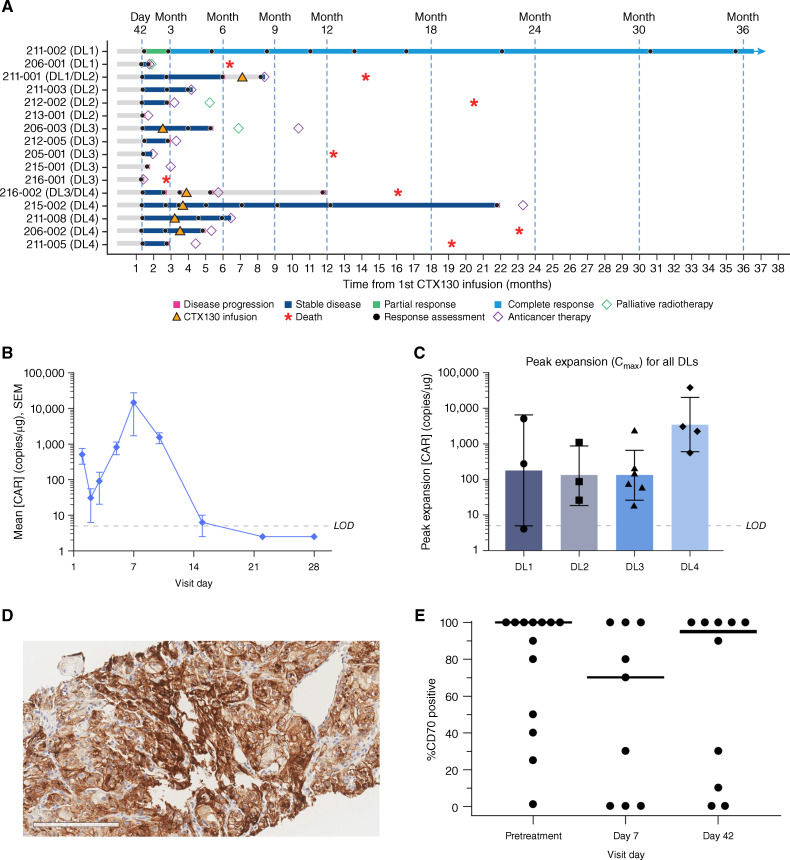
Figure 2.
Clinical efficacy and pharmacokinetics of CTX130 and CD70 expression in a phase I clinical trial. A, Responses in COBALT-RCC participants stratified by DL received. B, Mean ± SEM peripheral blood concentrations of CTX130 over 28 days after first infusion at DL4 (n = 4). Values below the LOD were imputed as half the LOD value. C, Peak expansion of CTX130 in peripheral blood following the first infusion at each DL tested in the COBALT-RCC trial. Each bar represents the geometric mean ± geometric SD with each point representing the peak expansion of 1 patient (n = 16). D, Representative 20× image of CD70 IHC staining in the tumor. Scale bar, 200 μm. E, CD70 positivity in tumor cells before treatment (n = 13), day 7 after infusion (n = 9), and day 42 after infusion (n = 10). Each point represents a tumor biopsy sample from 1 patient, and bars represent median values. CAR, chimeric antigen receptor; Cmax, peak expansion concentration; DL, dose level; IHC, immunohistochemistry; LOD, limit of detection.

