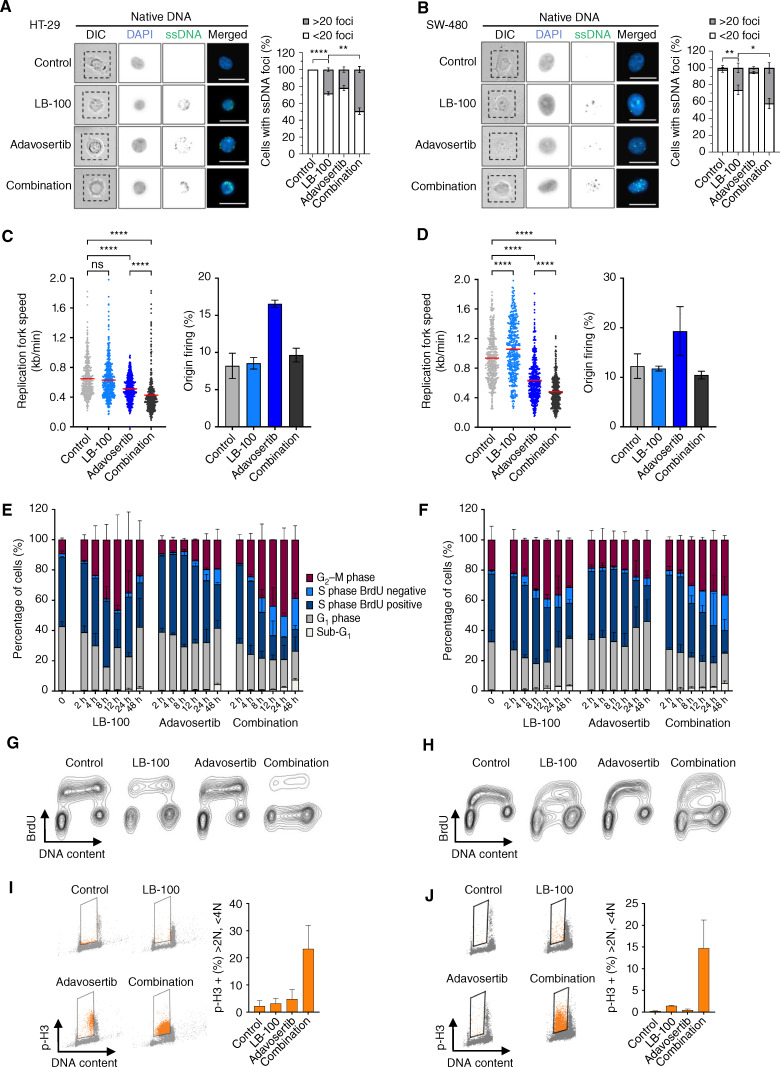
Figure 5.
LB-100 and adavosertib promote concerted replication stress, priming for premature mitoses. Representative images and quantifications of single-strand DNA ssDNA foci in HT-29 (A) and SW-480 (B) cells. After incorporating BrdUrd for 48 hours, the cells were treated as indicated for 8 hours and then fixed. Total DNA was stained with DAPI (blue) and BrdUrd was immunostained (green) under non-denaturing conditions to indicate long fragments of ssDNA. Quantification is based on 2 independent experiments analyzing at least 100 cells per coverslip. Asterisks indicate significance level (*, P < 0.05; **, P < 0.01; ****, P < 0.0001) by two-tailed unpaired t test. C and D, DNA fiber assays show replication fork speed (left) and percentage of origin firing (right) of HT-29 and SW-480 cells, respectively, untreated (DMSO) or treated with LB-100, adavosertib, or the combination for 8 hours. For fork speed, track lengths of at least 380 ongoing forks from each condition were measured with ImageJ in 2 independent experiments that are shown combined. Red lines indicate the mean and asterisks indicate the significance level (****, P < 0.0001) by the nonparametric Kruskal–Wallis test. For origin firing, first-label and second-label origins are shown as a percentage of all labeled tracks. At least 1,000 labeled tracks per condition were analyzed. E and F, Quantification of time-course cell-cycle flow cytometry from HT-29 and SW-480 cells, respectively, treated with LB-100, adavosertib, or the combination. Cells were fixed at the indicated time points after the addition of the drugs. BrdUrd (10 μmol/L) was added 1 hour before fixation. Total DNA was stained by propidium iodide (PI) and BrdUrd was immunostained. Cell-cycle phases were gated using the FlowJo software. Error bars represent the standard deviation of 2 independent experiments. G and H, Representative image of the 12-hour time point from the time-course flow cytometry above. I and J, Flow cytometry assessment of p-H3 (Ser10) vs. DNA content in HT-29 and SW-480 cells, respectively, treated with LB-100, adavosertib, or the combination for 12 hours. Total DNA was stained by propidium iodide (PI) and p-H3 (Ser10) was immunostained. S-phase cells were gated using the FlowJo software. Error bars represent the standard deviation of 2 independent experiments. Throughout the figure, LB-100 was used at 4 μmol/L on both cell lines. Adavosertib was used at 200 nmol/L in HT-29 and 400 nmol/L in SW-480.

