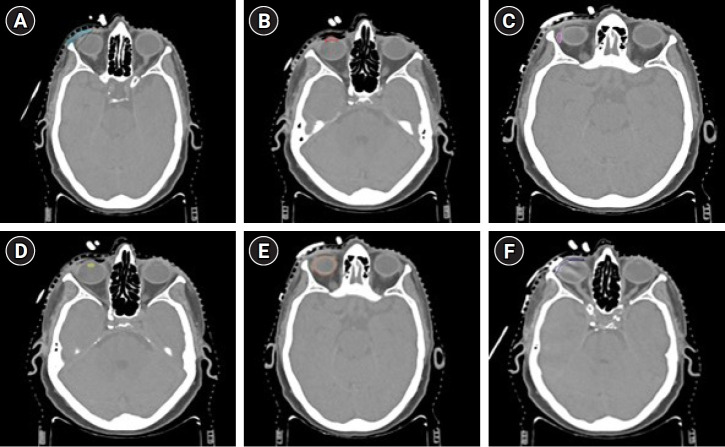
Fig. 2.
Computed tomography (CT) scans after CT simulation depicting delineation of target and various organs-at-risk. (A) The delineation of clinical target volume (light blue), (B) anterior chamber (red), (C) lacrimal gland (pink), (D) lens (yellow), (E) eyeball (orange), and (F) wax-covered lead mould (deep blue).

