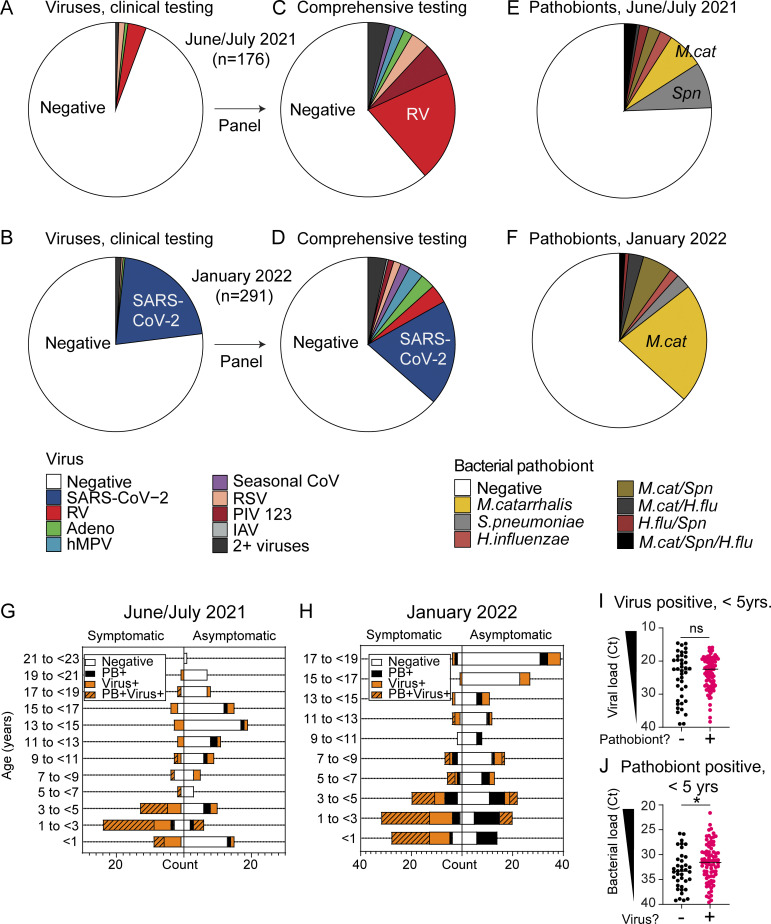
Figure 2.
Respiratory virus and bacterial pathobiont testing results. (A and B) NP swab sample respiratory virus test results from pediatric ED clinical care testing from June 3 to July 2, 2021 (n = 176) (A) and January 11 to 23, 2022 (n = 291) (B). (C and D) NP swab sample respiratory virus test results following comprehensive 16-virus panel testing from June 3 to July 2, 2021 (n = 176) (C) and January 11 to 23, 2022 (n = 291) (D). (E and F) NP swab sample bacterial pathobiont testing results from June 3 to July 2, 2021 samples (n = 176) (E) and January 11 to 23, 2022 samples (n = 291) (F). (G and H) Number of samples testing negative for respiratory viruses and pathobionts (white), positive for respiratory viruses (orange), bacterial pathobionts (black), or both (orange/black pattern) as represented by subject age and clinical presentation for June 3–July 2, 2021 (n = 176) (G) and January 11–23, 2022 (n = 291) (H). (I) Viral load (represented as PCR Ct) within virus-positive samples from children <5 years old (n = 120) based on whether a bacterial pathobiont was detected. The Mann–Whitney test is used to compare viral load between groups. ns = not significant. (J) Pathobiont load (represented as Ct) within pathobiont-positive samples from children <5 years old (n = 118) based on whether a respiratory virus was detected. The Mann–Whitney test is used to compare pathobiont load between groups. *P = 0.0259.

