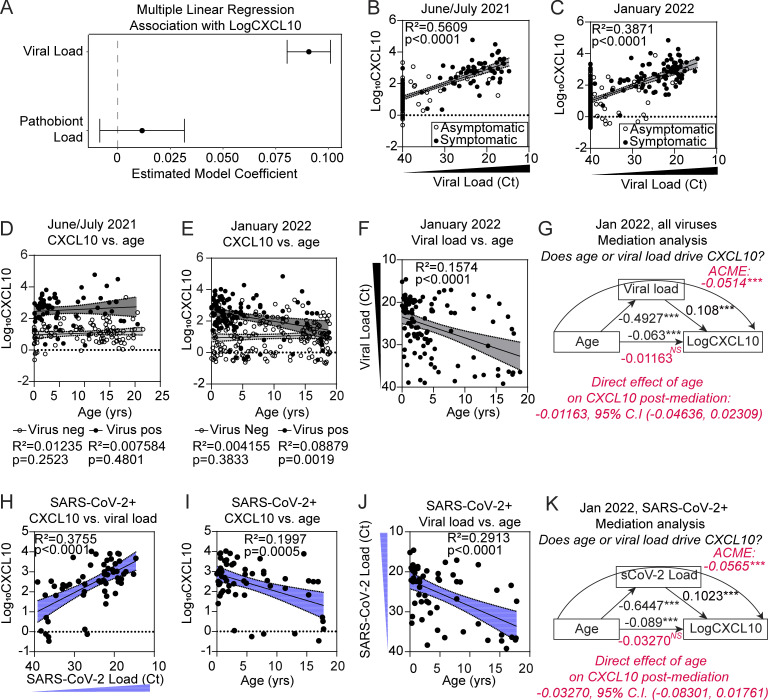
Figure 3.
Relationship between viral load, age, and NP CXCL10 level in pediatric subjects from June/July 2021 and January 2022. (A) Results from multiple linear regression analysis predicting Log10CXCL10 (pg/ml) based on viral load and pathobiont load. 95% confidence intervals (CI) show the estimated model coefficient associated with each IV. Results are shown for combined June/July 2021 and January 2022 datasets (n = 467). (B and C) Linear regression results between Log10CXCL10 (pg/ml) (DV) and viral load (Ct) for June/July 2021 (n = 176) (B) and January 2022 (n = 291) (C) for subjects with (black dots) and without (white dots) symptoms. In samples with viral coinfections, the highest viral load (minimum Ct value) is plotted. R-squared and P value shown for each linear regression result. (D and E) Log10CXCL10 (pg/ml) versus age in the June/July 2021 (n = 176) (D) and January 2022 (n = 291) (E) dataset. Linear regressions are performed separately for virus-positive samples (black dots) and virus-negative samples (white dots). (F) Viral load (Ct) versus age for all virus-positive samples in the January 2022 dataset (n = 106). Data were analyzed using linear regression. R-squared and P value are shown for linear regression. (G) Mediation analysis results for viral load (input into model as 40-Ct) as a mediator between age and CXCL10 in virus-positive samples (n = 106). Figure depicts the ACME and associated 95% CI through viral load denoted by the curved arrow (−0.0514 [−0.0831, −0.03], P < 2 × 10–16) and the ADE of age on CXCL10 (−0.0116 [−0.0484, 0.03], P = 0.56). 95% CIs obtained from 1,000 bootstrapped samples. (H) Log10CXCL10 (pg/ml) versus viral load (Ct) in SARS-CoV-2–positive samples (single viral infection only, n = 57). Data were analyzed using linear regression with the 95% CI shown. R-squared and P values are shown for linear regression. (I) Log10CXCL10 (pg/ml) versus age in SARS-CoV-2–positive samples (n = 57). Data are analyzed using linear regression with the 95% CI shown. R-squared and P value are shown for linear regression. (J) SARS-CoV-2 viral load versus age in SARS-CoV-2–positive samples (n = 57). Data were analyzed using linear regression with the 95% CI shown. R-squared and P value are shown for linear regression. (K) Mediation analysis results for SARS-CoV-2 load (Ct value) as a mediator between age and CXCL10 in SARS-CoV-2–positive samples (n = 57). Figure depicts the ACME and associated 95% CI through viral load denoted by the curved arrow (−0.0500 [−0.0972, −0.03], P < 2 × 10–16) and the ADE of age on CXCL10 (−0.0106 [−0.0886, 0.03], P = 0.274). 95% CIs obtained from 1,000 bootstrapped samples.

