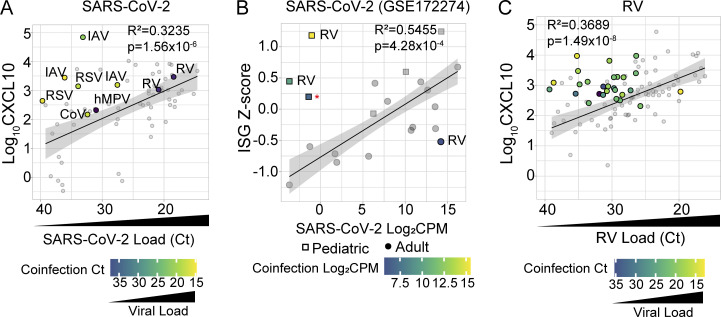
Figure 4.
NP innate immune response in SARS-CoV-2+ and RV+ subjects with and without co-infecting respiratory viruses. (A) NP Log10CXCL10 (pg/ml) versus SARS-CoV-2 viral load (Ct value) in samples with viral coinfections (colored dots, n = 9) and without viral coinfections (gray dots, n = 59) from June/July 2021, August 2021, and January 2022 cohorts. Linear regression is performed on SARS-CoV-2 single infections only with the 95% CI shown. R-squared and P value of linear regression analysis are added to the top right corner. Dots in viral coinfections are color-coded according to the viral load of the coinfecting virus. IAV = influenza A virus; CoV = seasonal coronavirus; hMPV = human metapneumovirus. (B) Viral load (Log2-CPM) versus nasal RNA-seq ISG Z-score for samples with and without SARS-CoV-2 viral coinfections in the GSE172274 dataset. Linear regression is performed on SARS-CoV-2 single infections only (gray symbols) with the 95% CI shown. R-squared and P value of linear regression analysis are added to the top right corner. Children are represented as squares while adults are represented as dots. Red asterisk = measles virus (Moraten vaccine strain). (C) NP CXCL10 (Log10 pg/ml) versus RV viral load (Ct value) in samples with viral coinfections (colored dots, n = 27) and without viral coinfections (gray dots, n = 70) from June/July 2021, January 2022, August 2021, and January 2022 cohorts. Linear regression is performed on RV single infections only (gray symbols) with the 95% CI shown. R-squared and P value of linear regression analysis are shown. Symbols in viral coinfections are color-coded according to the viral load of the coinfecting virus.

