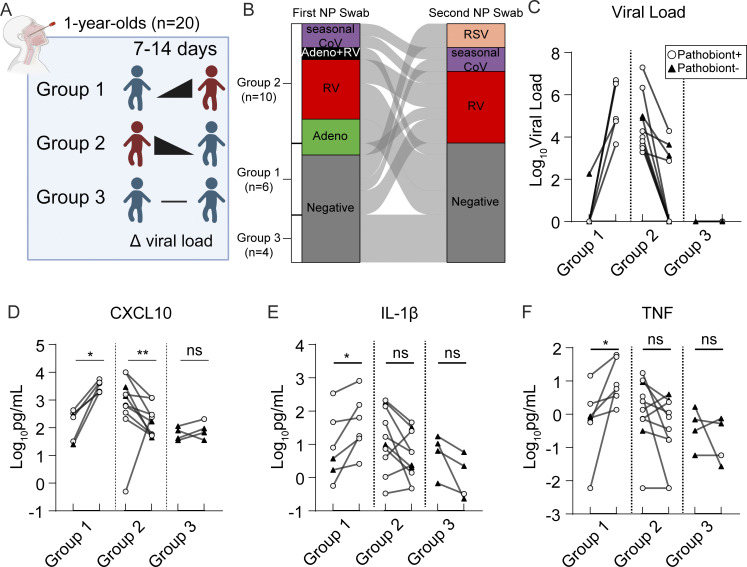
Figure 7.
Analysis of paired NP swabs from 1-year-old children presenting for well visits. (A) NP swabs were collected from 1-year-old children (n = 20) presenting to the pediatric clinic for well visits. One NP swab was collected at the time of the appointment, and a second NP swab was collected 7–14 days later from the same children. Children were separated into three groups based on respiratory viral panel results: Group 1 includes children who experienced the acquisition of or increase in viral load between the first and second visits (n = 6); Group 2 includes children who experienced a decrease in viral load between the first and second visits (n = 10); Group 3 includes children who were virus-negative on both visits (n = 4). (B) Dynamics of respiratory viral panel results are shown as an alluvial diagram for each group of 1-year-old children for NP swabs taken on the first and second visits. (C) Log10 viral load (based on Ct value relative to detection limit) is shown for each group of children. (D–F) Cytokine protein concentrations are plotted for each group as a Log10 pg/ml transformed values for CXCL10 (D), IL-1β (E), and TNF (F). Paired samples are analyzed using the Wilcoxon signed-rank test on non-scaled cytokine concentrations. ns: not significant (P > 0.05); *: P = 0.0312; **: P = 0.0059.

