Figure 10.
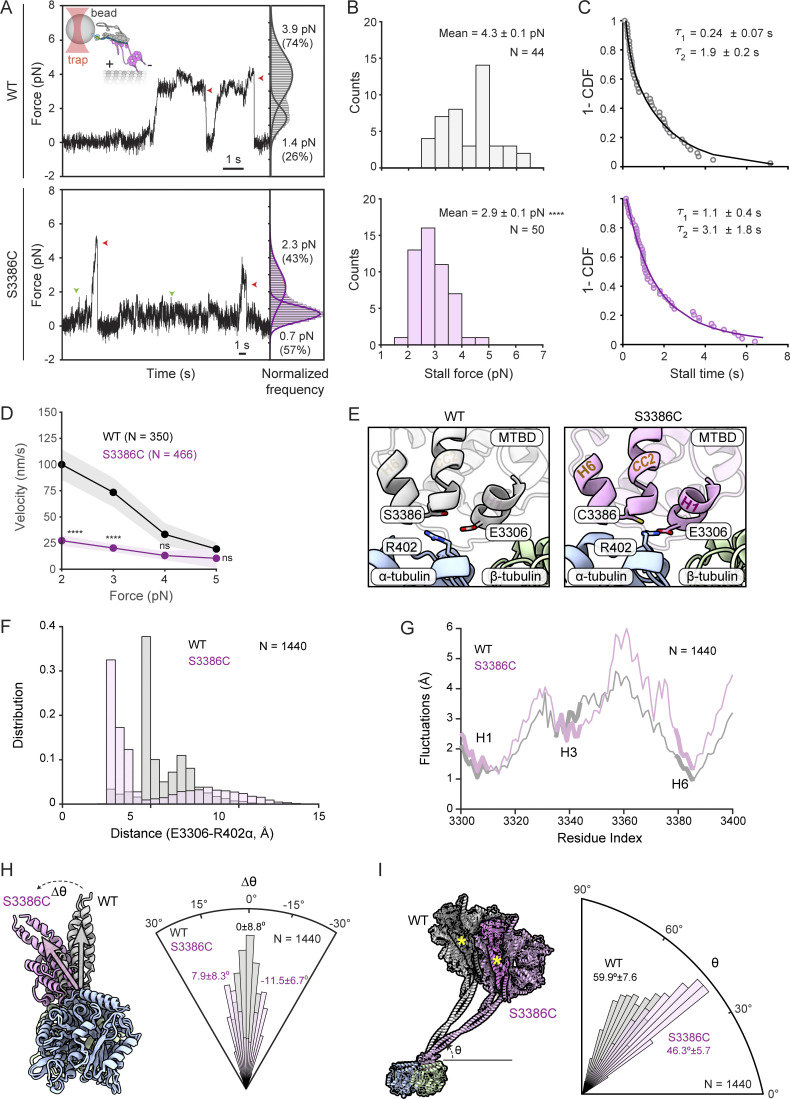
The S-to-C mutation alters dynein behavior under load and MTBD/stalk positioning relative to the microtubule. (A) Left: Representative traces of beads driven by a single wild-type (WT) or S3386 DDB complex in a fixed optical trapping assay. Traces were downsampled to 250 Hz. Red arrowheads show detachment of the motor from a microtubule after the stall; green arrowheads show pausing of the mutant dynein at low forces. The inset cartoon shows DDB attachment to beads through GFP-BICD2N/GFP-antibody linkage. Right: Normalized histograms showing probability of a dynein-driven bead sampling different forces. Dwelling of the beads at 0 pN when they are not tethered to the microtubule was subtracted from the histogram. Solid curves represent a multiple Gaussian fit to calculate the mean and percent population of the two peaks. (B) Stall forces of DDB complexes with WT and mutant dynein (errors are SEM; N is number of stalls). (C) Inverse cumulative distribution (1-CDF) of motor stall times. Time constants (τ ± SEM) were calculated from a fit to a double exponential decay (solid curves). (D) Force velocity plots for DDB complexes with WT and mutant dynein (errors are SEM; N is number of events). In A–D, data are from 11 beads in five independent experiments for WT and from 14 beads in seven independent experiments for mutant. In B and D, statistical significance was evaluated with an unpaired, two-tailed t test. ****, P < 0.0001; ns, not significant. In D, comparisons were to WT values at the same force. (E) Example snapshots of E3306(dynein) and R402(α-tubulin) positioning in MD simulations of WT and S3386C MTBD plus portion of the stalk in the presence of the α/β-tubulin dimer. (F) Distance distributions of E3306(dynein)-R402(α-tubulin) in WT and S3386C simulations. (G) Fluctuations of WT and S3386C MTBD and portion of the stalk with respect to the microtubule in MD simulations. (H) Left, superimposition of examples from simulations with the WT and S3386C MTBD plus a portion of stalk when viewed down the longitudinal axis of the microtubule. Gray and magenta vectors show most frequent MTBD orientation for WT and S3386C, respectively. Right, angular orientation histogram (normalized frequency) for the MTBD around the longitudinal axis of the microtubule. The WT distribution exhibited a single peak (assigned a value of 0), whereas the S3386C mutant exhibited a double-peaked distribution (peaks of fitted curves ± SD are shown). (I) Left: Superimposition of examples from simulations with WT and S3386C MTBD plus a portion of the stalk when viewed facing the longitudinal axis of the microtubule. The remainder of the dynein motor domain structure (PDB 7Z8F; Chaaban and Carter, 2022) was superimposed on the simulations to show the predicted position of the linker (darker shading and yellow asterisk) and AAA+ ring. Right, angular orientation histogram (normalized frequency) for the stalk relative to the longitudinal axis of the microtubule (peaks of distributions ± SD are shown). In F–I, N is number of simulation trajectories for each type of complex.

