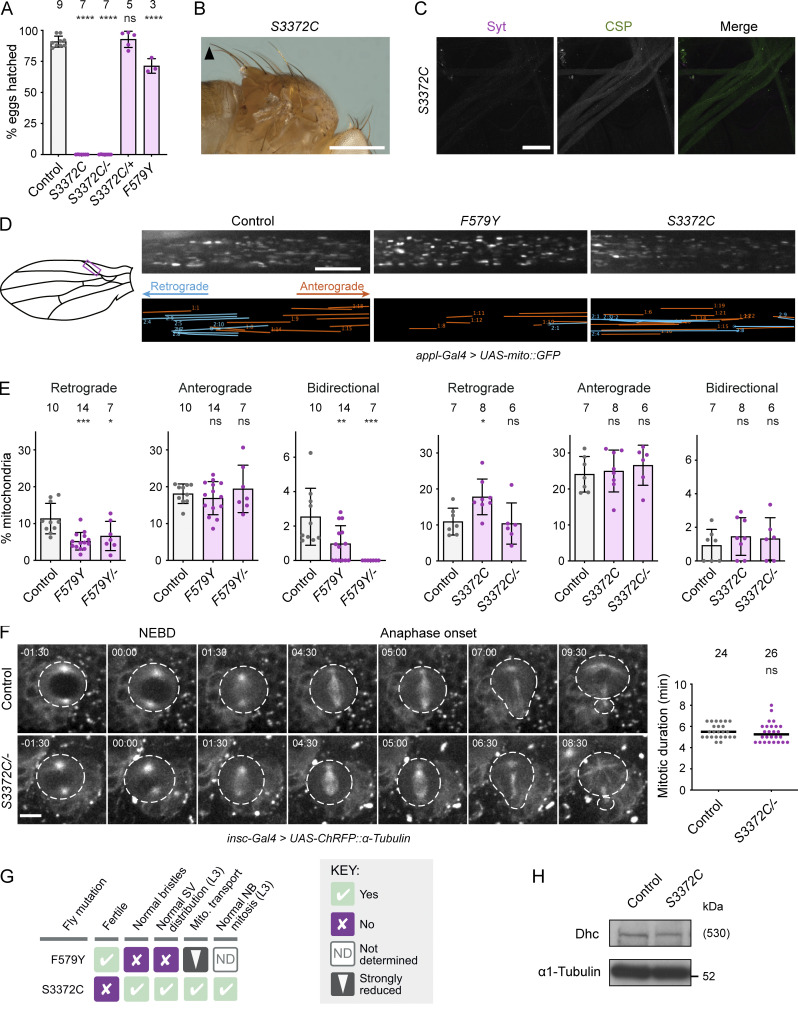
Figure 2.
The novel mutation S3372C selectively affects embryonic development. (A) Hatching frequency of eggs laid by mated females of the indicated genotypes. Columns show mean values per egg collection; error bars represent SD; circles are values for individual egg collections. Number of collections per genotype (from three independent crosses) is shown above columns (114–575 eggs per collection). S3372C/− are trans-heterozygous for S3372C and a Dhc null allele. Control genotype: yw. (B and C) Images showing (B) normal bristle length in adults and (C) lack of synaptic vesicle accumulations in L3 segmental nerves (proximal to the ventral ganglion; anterior to the top; Z-projection) in S3372C homozygotes (for comparisons with controls, see Fig. 1, D and E). The arrowhead in B points to posterior scutellar macrochaetae. Images in B and C are representative of >160 flies and three larvae analyzed, respectively. (D) Analysis of mitochondrial motility in wing nerve axons of 2-day-old control, F579Y, and S3372C adult flies. Left, cartoon of wing region imaged (magenta box). Top images, example stills from 3-min time series (single focal plane) of fluorescent mitochondria (expression of mito::GFP with a pan-neuronal driver). Bottom images, traces of motile mitochondria in corresponding time series. Blue, retrograde tracks; orange, anterograde tracks. (E) Percentages of mitochondria transported in the retrograde or anterograde directions, or moving bidirectionally, during the 3 min of data acquisition. Columns show mean values per movie; error bars represent SD; circles are values for individual movies (each from a different wing). Number of wings analyzed shown above bars. Note that we observed an increased frequency of retrograde transport in S3372C homozygotes, but this was not recapitulated in S3372C/− animals. (F) Analysis of mitotic duration in neuroblasts (NBs) in control and S3372C/− L3 larval brains. Left: Stills from image series of NBs with fluorescently labeled spindles (expression of RFP-tagged α-tubulin with an NB-specific driver). NBs and daughter cells highlighted with dashed lines. Timestamps are min:s after nuclear envelope breakdown (NEBD). Right: Quantification of mitotic duration (NEBD to anaphase onset). Lines show medians; circles are values for individual NBs. Number of NBs analyzed (from four wild-type or five S3372C/− larvae) shown above plot. (G) Summary of in vivo effects of homozygosity for F579Y and S3372C. SV, synaptic vesicle; Mito., mitochondrial. (H) Immunoblot of extracts of embryos from control and S3372C mothers (0–160-min collections), probed with antibodies to Dhc and α1-tubulin (loading control). The position of the molecular weight (Mw) marker is shown for α1-tubulin blot region; as there is no marker where Dhc migrates, the predicted Mw of Dhc is shown in parentheses. Evaluation of statistical significance (compared to control) was performed with a one-way ANOVA with Dunnett’s multiple comparisons test (A and E) or a Mann-Whitney test (F): ****, P < 0.0001; ***, P < 0.001; **, P < 0.01; *, P < 0.05; ns, not significant. Scale bars: B, 500 µm; C, 50 µm; D, 10 µm; F, 5 µm. Source data are available for this figure: SourceData F2.

