Figure 7.
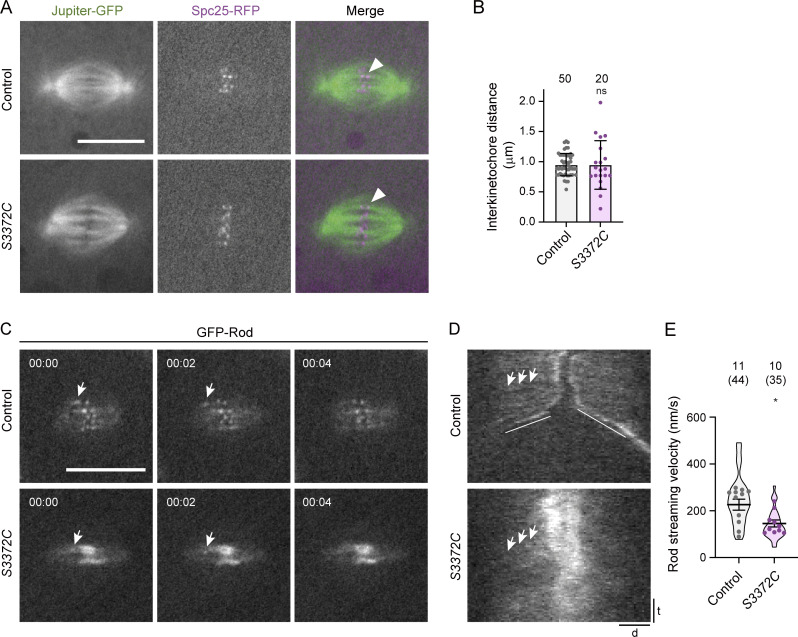
S3372C alters kinetochore-associated processes. (A) Example confocal images of mitotic spindles (single focal plane) in live control and S3372C embryos that have fluorescently labeled microtubules (Jupiter-GFP) and kinetochores (Spc25-RFP). Arrowheads, examples of association of bundled microtubules with a kinetochore. (B) Quantification of interkinetochore distance (using centroids of Spc25-RFP signals) in live control and S3372C metaphase spindles. Columns show mean values; error bars represent SD; circles are values for individual kinetochore pairs. Number of kinetochore pairs analyzed (from seven control and eight S3372C embryos) shown above bars. (C) Example stills from a time series (single focal plane) showing transport of GFP-Rod particles away from the kinetochore in control and S3372C embryos (arrows). Timestamps are min:s. (D) Example kymographs showing GFP-Rod streaming (e.g., arrows). d, distance; t, time. Diagonal lines in the control label poleward movements of whole kinetochores in anaphase. (E) Quantification of GFP-Rod streaming velocity. Violin plots show values for individual motile Rod particles and circles show mean values per embryo. Horizontal lines show mean ± SD of values for individual motile particles. Numbers without parentheses above bars are the number of embryos, with the total number of particles given in parentheses. In B and E, statistical significance was evaluated with an unpaired, two-tailed t test (in E, comparisons were between mean values per embryo). *, P < 0.05; ns, not significant. Scale bars: A and C, 10 µm; D distance, 2 µm; D time, 30 s.

