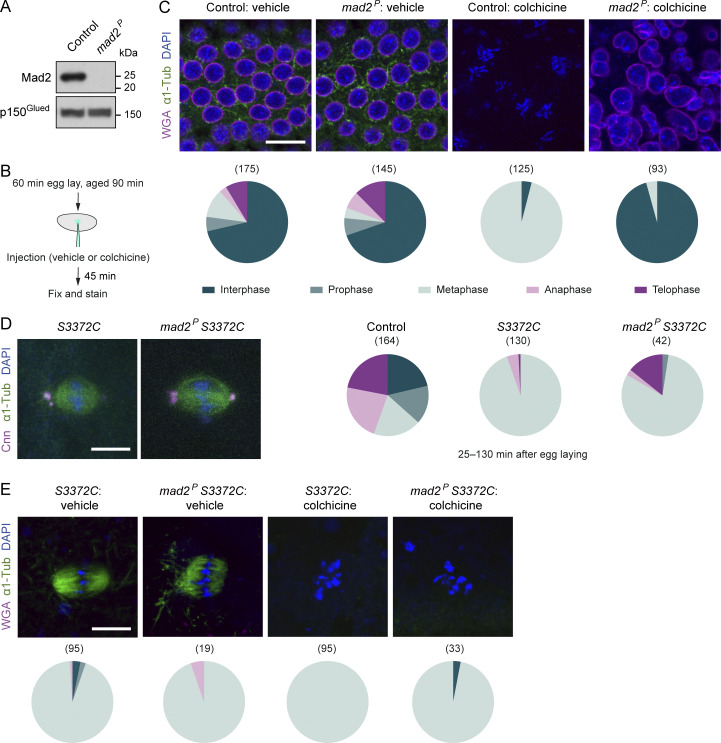
Figure 8.
Mad2-independent metaphase arrest in S3372C mutant embryos. (A) Immunoblot of extracts of embryos from control (w1118) and mad2P mothers (0–120-min collections), probed with antibodies to Mad2 and p150Glued (loading control). (B) Summary of experimental protocol for colchicine injections; vehicle is 1% DMSO. (C) Top, example confocal images (single focal plane) of control (w1118) and mad2P embryos injected with vehicle or colchicine and stained with antibodies to α1-tubulin (α1-Tub; microtubules), as well as WGA (nucleoporins, which are absent from the nuclear envelope in metaphase and anaphase [Katsani et al., 2008]) and DAPI (DNA). Colchicine-injected wild-type embryos arrest in metaphase with condensed chromosomes whereas mad2 embryos decondense their chromosomes and reach interphase (Yuan and O’Farrell, 2015). Bottom, incidence of mitotic stages for each condition. (D) Left, example confocal images (Z-projection) of metaphase spindles from fixed embryos of S3372C and mad2P, S3372C mothers stained as indicated, and, right, incidence of mitotic stages in control, S3372C and mad2P, S3372C embryos (25–130-min collection). Compared with the vehicle control in panel C, a smaller proportion of embryos are in interphase in this control as the relatively young age of embryos in the cohort enriches for rapid early division cycles. (E) Top: Example confocal images (single focal plane) of embryos of the indicated genotypes injected with vehicle or colchicine and stained with antibodies to α1-Tub, as well as WGA and DAPI. Bottom: Incidence of mitotic stages for each condition. In pie charts in D and E, mitotic stages are color-coded as in C. In C–E, numbers in parentheses indicate number of nuclei counted per genotype; data are from 35 control-vehicle, 29 mad2P-vehicle, 25 control-colchicine and 20 mad2P-colchicine (C), 34 control, 49 S3372C, and 33 mad2P, S3372C (D), and 34 S3372C-vehicle, 13 mad2P S3372C-vehicle, 24 S3372C-colchicine, and 26 mad2P S3372C-colchicine (E) embryos, with no more than five randomly selected nuclei analyzed per embryo. Scale bars: C, 15 µm; D and E, 10 µm. Source data are available for this figure: SourceData F8.

