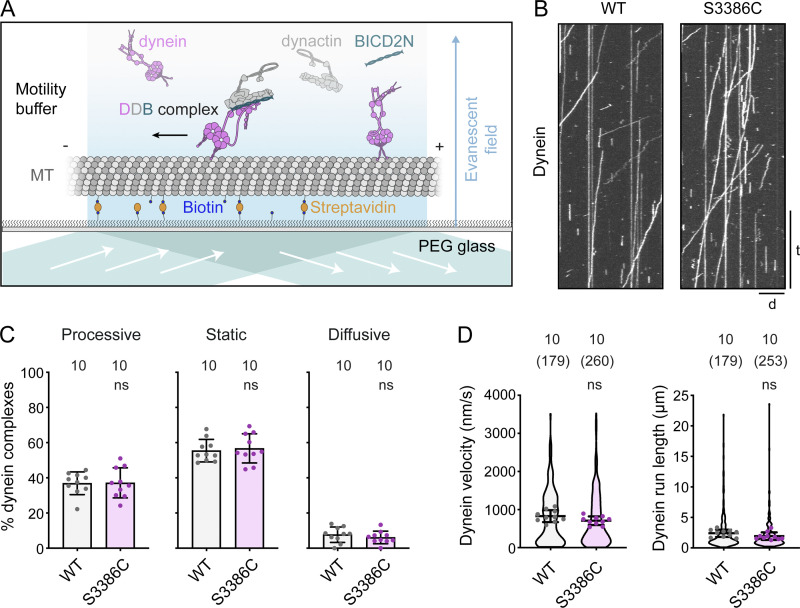
Figure 9.
The S-to-C mutation does not alter motility of isolated dynein-dynactin-activating adaptor complexes. (A) Diagram of TIRF microscopy–based in vitro motility assay using an assembly of TMR-labeled dynein, dynactin, and BICD2N. In the absence of dynactin and BICD2N, dynein is autoinhibited and not capable of long-range transport. MT, microtubule; PEG, polyethylene glycol passivation surface. (B) Example kymographs of wild-type (WT) or S3886C tetramethylrhodamine (TMR)-dynein motility in the presence of dynactin and BICD2N. The microtubule minus end is to the left. d, distance; t, time. Scale bar: distance, 5 µm; time, 20 s. (C and D) Quantification of the percentage of microtubule-associated dynein complexes that exhibit processive, static, or diffusive behavior (C), and velocity and run length of the processive dynein fraction (D). In C, columns display mean values for individual microtubules; error bars are SD; circles are values for individual microtubules. Numbers above each column indicate the total number of microtubules analyzed. In D, violin plots show values for individual motile DDB complexes and circles show mean values per microtubule. Horizontal lines show mean ± SD of values for individual DDB complexes. Numbers without parentheses above bars are numbers of microtubules, with total numbers of motile DDB complexes in parentheses. In C and D, statistical significance was evaluated with an unpaired, two-tailed t test (in D, comparisons were between mean values per microtubule). ns, not significant. Data were summed from two experiments per condition. See Fig. S5, C and D for histograms of velocity and run length.

