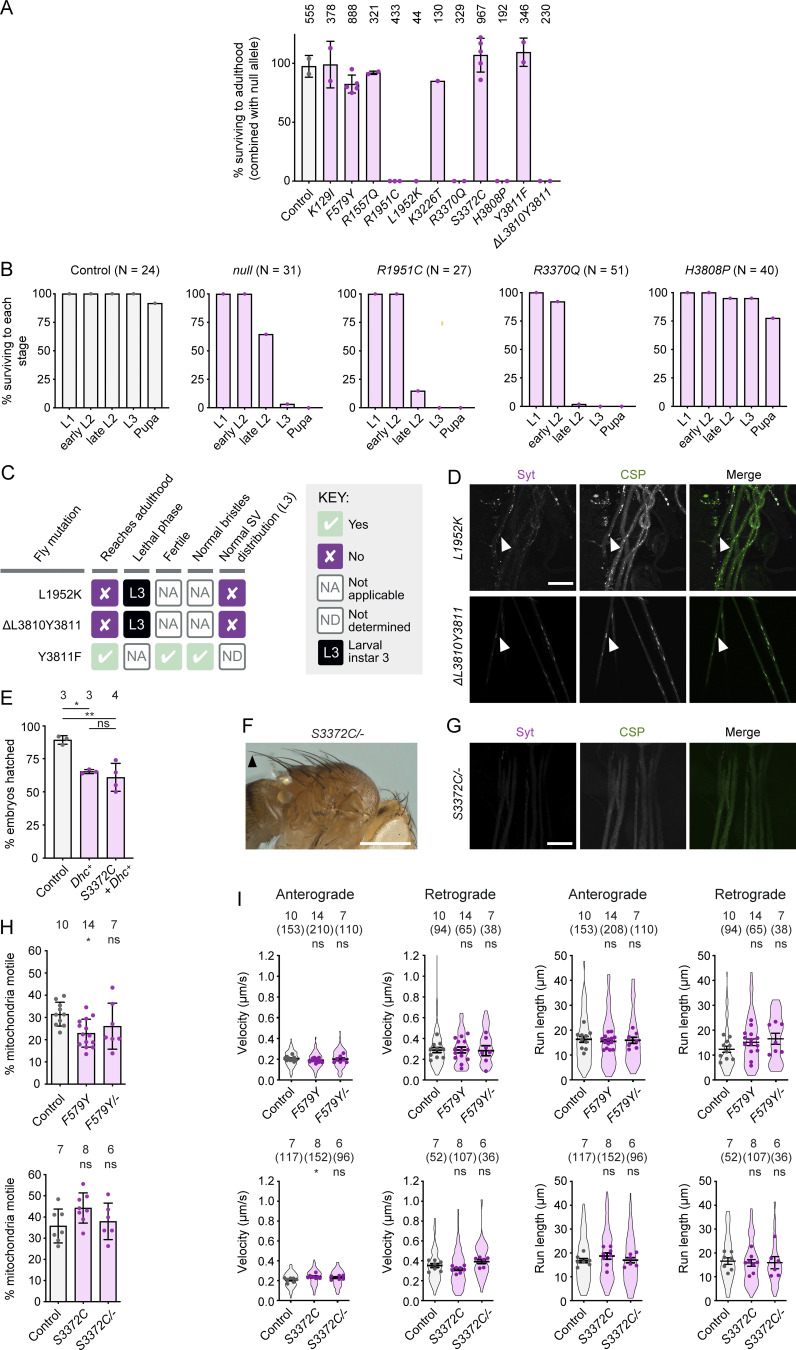
Figure S1.
Supplementary data from phenotypic analysis of Dhc mutations. (A) Complementation tests showing percentage survival to adulthood of flies trans-heterozygous for the indicated Dhc mutation and a Dhcnull allele. Columns display mean values from individual crosses; error bars are SD; circles are values for individual crosses. Data were normalized based on the number of each genotype expected if there was no lethality given the total number of offspring. Numbers above each column show the total number of offspring assessed for each genotype. (B) Percentage of L1 larvae of indicated genotypes reaching the specified stage (there was no overt lethality at the embryonic stage). N is the number of animals analyzed for each genotype. In A and B, control animals were trans-heterozygous for a wild-type Dhc allele (recovered from the same CRISPR-Cas9 mutagenesis experiment that generated the Dhc mutant alleles) and the Dhcnull allele. (C) Summary of in vivo effects of L1952K, ΔL3810Y3811 and Y3811F. SV, synaptic vesicle. (D) Confocal images of segmental nerves (taken proximal to the ventral ganglion; anterior to the top; Z-projection) from L3 larvae stained for Synaptotagmin (Syt) and Cysteine-string protein (CSP). Arrowheads show examples of synaptic vesicle accumulations in mutants. Images are representative of three to six larvae analyzed per genotype. See Fig. 1 E for images from control. (E) Quantification of hatching frequency of eggs laid by mated females of indicated genotypes. Columns show mean values per egg collection; error bars represent SD; circles are values for individual egg collections. Numbers of collections per genotype (each from an independent cross; 414–1,107 eggs per collection) shown above bars. Control genotype was yw. Dhc+ is a genomic rescue construct; note this construct reduces hatching rate in the wild-type background and that fertility defects of S3372C mothers are only suppressed by the transgene to this point. (F) Image (representative of >160 flies examined) showing normal bristles in S3372C/− adult flies. Arrowhead points to posterior scutellar macrochaetae. See Fig. 1 D for control image. (G) Confocal images of segmental nerves (taken proximal to the ventral ganglion; anterior to the top; Z-projection) from fixed L3 larvae stained for Syt and CSP, showing lack of abnormal synaptic vesicle accumulations. Images are representative of three larvae analyzed. See Fig. 1 E for images from control. (H) Quantification of the percentage of mitochondria that exhibit transport in any direction in the adult wing nerve during the 3 min of data acquisition. Columns show mean values per movie; errors bars represent SD; circles are values for individual movies, each from a different wing. Number of wings analyzed shown above bars. (I) Quantification of velocity and run length of transported mitochondria in the adult wing nerve. Violin plots show values for individual mitochondria; circles show mean values per wing. Horizontal lines show mean ± SD of values for individual wings. Numbers without parentheses above bars are number of wings, with numbers of mitochondria in parentheses. Evaluation of statistical significance (compared to control) in E, H, and I was performed with a one-way ANOVA with Dunnett’s multiple comparisons test (in I, the mean values per wing were compared): **, P < 0.01; *, P < 0.05; ns, not significant. Scale bars: D and G, 50 µm; F, 500 µm.

