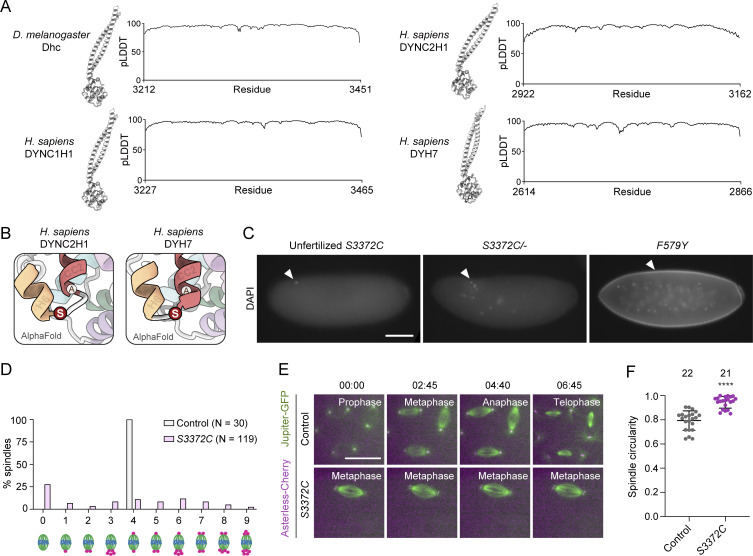
Figure S2.
Supplementary data from structural and phenotypic analysis of S3372. (A) Structural overview and pLDDT (predicted local distance difference test) plots (Jumper et al., 2021) of Alphafold2-generated structures of dynein MTBD and stalk regions. The high pLDDT values show that predictions are high confidence. (B) Zoom-ins of regions containing serine (S) residues equivalent to Drosophila S3372 in Alphafold2-generated structures of the MTBD and stalk regions of human DYNC2H1 (dynein-2 heavy chain) and DYH7 (inner arm axonemal dynein). Positions of residues equivalent to Drosophila S3372 are shown in red; alanines (A) at residues equivalent to the cysteines at the base of CC2 in several other dyneins are also shown. (C) Example widefield images from a 2- to 4-h egg collection of fixed, DAPI-stained unfertilized eggs from virgin S3372C females, or embryos from mated S3372C/− or F579Y females (arrowheads show DNA staining). Images are representative of at least 150 embryos examined. (D) Categorization of mitotic spindle phenotypes in S3372C embryos based on centrosome number and arrangement. A range of mitotic stages was present in control embryos (yw), whereas >90% of mutant spindles were at metaphase; only those control and mutant embryos in metaphase were scored for this analysis. N is the number of spindles scored (from six control and 49 S3372C embryos; no more than five randomly selected metaphase spindles analyzed per embryo). (E) Example stills from time series (single focal plane) of control and S3372C embryos acquired during preblastoderm cycles. Jupiter-GFP and Asterless-Cherry label microtubules and centrosomes, respectively. Note abnormal presence of two centrosomes at each pole of the mutant spindle. Images were binned 2 × 2. Timestamps are min:s. (F) Quantification of circularity of randomly selected spindles from early cleavage stage control and S3372C embryos (larger number equates to more circularity). Horizontal lines show means; error bars are SD; circles are values for individual spindles. Number of spindles analyzed per genotype shown above bars. Statistical significance was evaluated with an unpaired, two-tailed t test. ****, P < 0.0001. Scale bars: C, 100 µm; E, 20 µm.

