Figure S3.
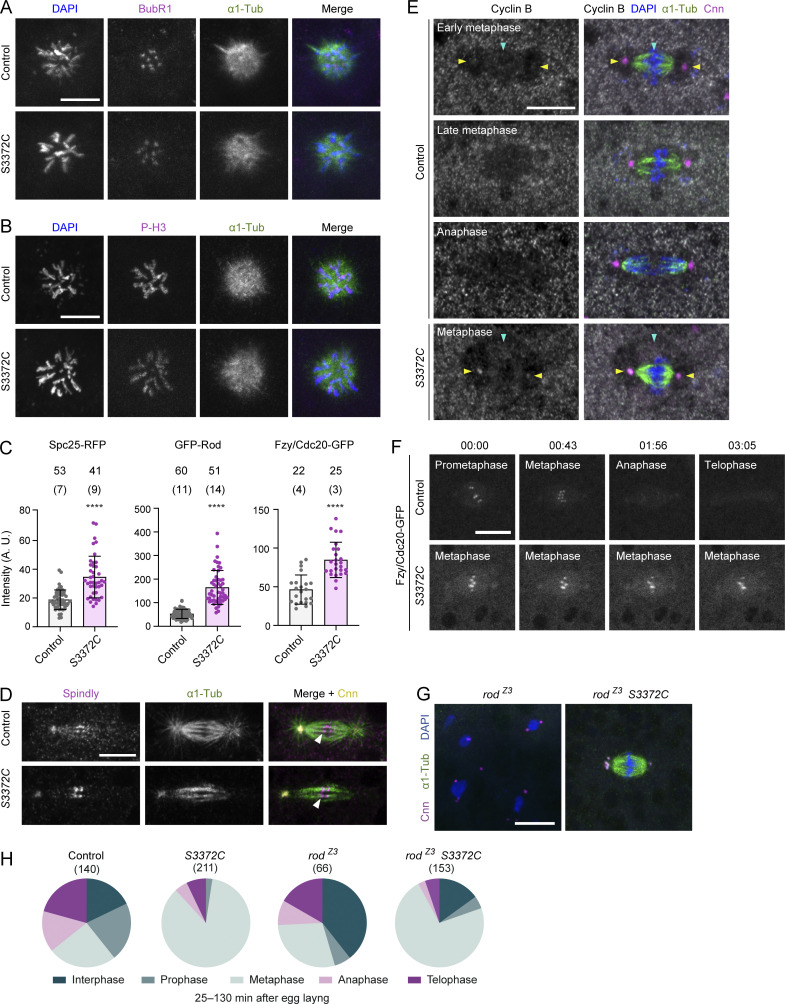
Supplementary data from analysis of S3372C mitotic phenotype. (A and B) Example confocal images of polar bodies in fixed control and S3372C embryos stained with DAPI, as well as antibodies to BubR1 and α1-tubulin (α1-Tub) (A) or phospho-histone H3 (P-H3) and α1-Tub (B) (Z-projections). (C) Quantification of intensity of Spc25-RFP, GFP-Rod, and Fzy/Cdc20-GFP puncta at the metaphase plate of control and S3372C embryos. Columns show means of values per punctum; error bars represent SD; circles are values for individual puncta. Number of puncta analyzed per genotype is shown above bars (number of embryos analyzed in parentheses). Statistical significance was evaluated with an unpaired, two-tailed t test (comparing per punctum means). ****, P < 0.0001. (D) Example confocal images of mitotic spindles in control and S3372C embryos stained with antibodies to Spindly, α1-Tub, and Centrosomin (Cnn), as well as DAPI. Arrowheads indicate an example of close apposition of plus ends of microtubule bundles and bright Spindly puncta at the kinetochore. Single focal planes were chosen to facilitate visualization of microtubule plus ends, which resulted in only one centrosome being visible in each image. (E) Example confocal images (Z-projections) of mitotic spindles in control and S3372C embryos stained with antibodies to Cyclin B, α1-Tub, and Cnn, as well as DAPI. Cyclin B shows weak accumulation in the vicinity of the spindle (blue arrowhead) and at centrosomes (yellow arrowheads) in early metaphase control embryos, which is lost by anaphase. In metaphase-arrested S3372C embryos, Cyclin B is detected in the vicinity of the spindle (blue arrowhead) and at centrosomes (yellow arrowheads). (F) Example stills of time series (single focal planes) of mitotic spindles acquired during preblastoderm cycles in live control and S3372C embryos expressing Fzy/Cdc20-GFP. Fzy/Cdc20-GFP is localized to the metaphase plate in metaphase-arrested mutant spindles (see panel C for quantification). In A–B and D–F, at least 30 embryos were examined per condition. In F, timestamps are min:s. (G and H) Example confocal images of embryos of the indicated genotypes stained with antibodies to α1-Tub and Cnn, as well as DAPI (G) and incidence of mitotic stages for each condition (H). There was a significantly higher incidence of metaphase in rodZ3 S3372C versus rodZ3 embryos (72.6% versus 28.8% [P < 0.0001; Fisher’s Exact test]). Data are from 28 control, 48 S3372C, 64 rodZ3, and 119 rodZ3 S3372C embryos with no more than five randomly selected nuclei or spindles analyzed per embryo. Note abnormal morphology of interphase nuclei in rodZ3 single mutants. Scale bars: A, B, and D–F, 10 µm; G, 20 µm.

