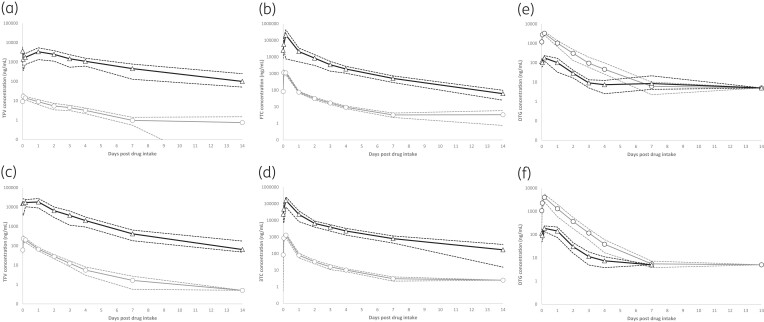
Figure 1.
Geometric mean (95% CI—dashed lines) concentrations in plasma and urine for (a) tenofovir (tenofovir alafenamide; TFVTAF), (b) emtricitabine (FTC), (c) tenofovir (tenofovir disoproxil; TFVTDF), (d) lamivudine (3TC) and (e) dolutegravir (DTG) (Arm 1) and (f) DTG (Arm 2), during the 14 day drug intake cessation period. Plasma values are indicated with grey lines (circles) and urine values with black lines (triangles). Detectable concentrations below the assay LLQ are expressed as half-LLQ values.

