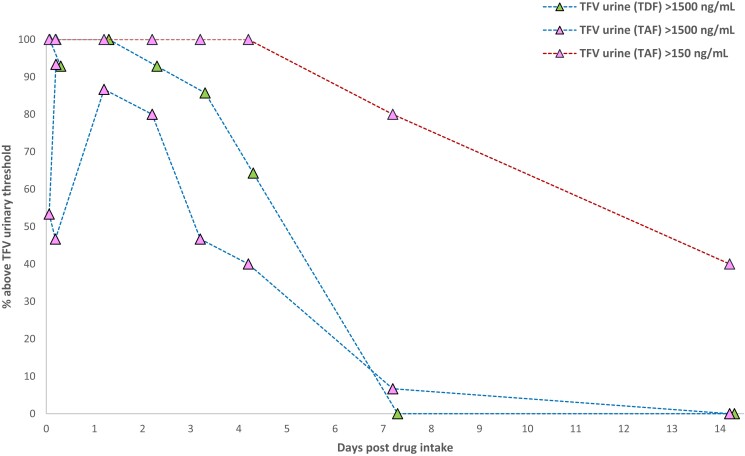
Figure 3.
Proportion of urine samples with tenofovir (TFV) concentrations >1500 ng/mL [tenofovir disoproxil fumarate (TDF) and tenofovir alafenamide (TAF) dosing] or >150 ng/mL (TAF dosing). The blue dashed line shows the 1500 ng/mL threshold and the red dashed line shows the 150 ng/mL threshold. TFVTAF = pink triangles; TFVTDF = green triangles. This figure appears in colour in the online version of JAC and in black and white in the print version of JAC.

