. 2024 Jul 3;38(4):1671–1676. doi: 10.21873/invivo.13617

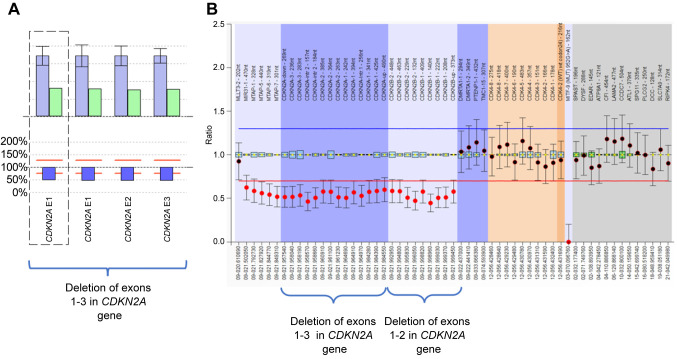
Figure 1. A: Detection of deletion of exons 1-3 in cyclin-dependent kinase inhibitor 2A (CDKN2A) gene from next-generation sequencing data using SeqNext (JSI) software. The bar plot illustrates the patient sample’s relative coverage of each target region of interest (ROI) in green and the average relative target coverage of control samples in blue. The ratio of the patient sample’s coverage of target ROIs against the controls is shown below each pair of bars. Reds lines correspond to the 75% deletion limit (lower red dotted line) and the 135% duplication limit (upper red dotted line) for the calculated ratio. The average relative target coverage data are reported as means±standard deviations of control samples. B: Sample plots from Coffalyser.net displaying probe ratios with 95% confidence intervals as error bars for CDKN2A and CDKN2B exons. The proband’s MLPA analysis revealed heterozygous deletion of exons 1-3 in CDKN2A and of exons 1-2 in CDKN2B (SALSA MLPA probemix P419; MRC Holland).

Figure 1