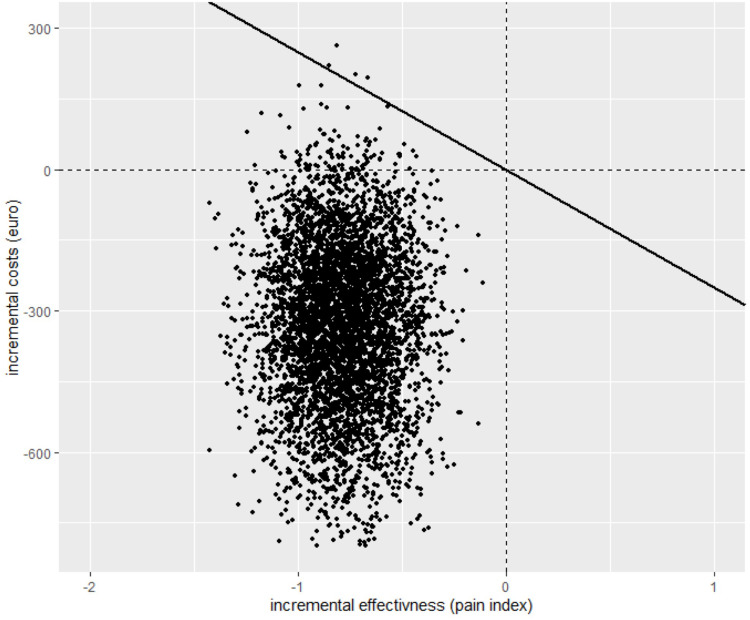
Figure 6.
The cost-effectiveness plane (CEP) shows superiority in the Rise-uP approach regarding cost-effectiveness: For Rise-uP 98% of all estimation parameters), most of the cost-effect pairs were located in the lower left quadrant of the CEP. In the case of the pain indices, where a lower value indicates a more effective intervention, this quadrant suggests better effects and fewer costs.

