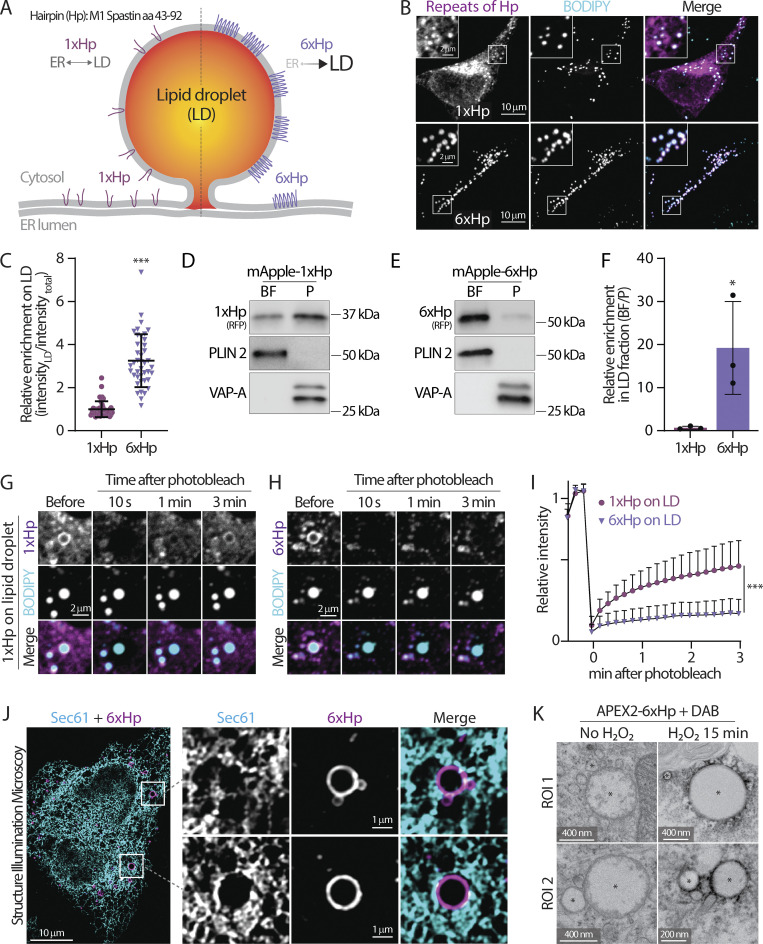
Figure 2.
The design and validation of a synthetic lipid droplet targeting motif. (A) Diagram depicting the ER and lipid droplet (LD) distribution of 1xHp (hairpin; amino acids 43–92 from human M1 Spastin) and 6xHp. (B) Localization of BODIPY 493/503-labeled LDs and mApple-1xHp or mApple-6xHp in HeLa cells treated with 100 µM oleic acid (OA) overnight. Maximal intensity projected (MIP) confocal images from six axial slices (1.8 µm in total thickness) are shown. (C) Quantification of relative enrichment of 1xHp and 6xHp on LDs from B. Raw data and mean ± SD are shown (53–56 cells from three independent experiments). ***P ≤ 0.001, assessed by two-tailed t test. (D and E) Distribution of mApple-1xHp or mApple-6xHp, LD marker perilipin 2 (PLIN 2), and an ER membrane marker, VAP-A, in sucrose-gradient cellular fractionations from HepG2 cells treated with 200 μM OA. BF, buoyant fraction; P, membrane pellet. (F) Quantification of the enrichment of mApple-1xHp or mApple-6xHp in the BF relative to the P fraction in D and E. Data are from three independent experiments (*P ≤ 0.05, assessed by two-tailed t test). (G and H) Fluorescence recovery after photobleaching (FRAP) of 1xHp (G) and 6xHp (H) on LDs in OA-treated U2OS cells labeled with BODIPY monitored by confocal microscopy. (I) Quantification of FRAP of G and H. Mean ± SD are shown (22–37 cells from three or four independent experiments). ***P ≤ 0.001, assessed by two-tailed t test. (J) Subcellular localization of Halo-6xHp relative to ER marker mEmerald-Sec61β in an OA-treated HeLa cell monitored via structured illumination microscopy. MIP images from 10 axial slices (∼2 µm in total thickness) are shown. (K) Electron micrographs of LDs in U2OS cells expressing APEX2-6xHp incubated with diaminobenzidine (DAB) in the absence or presence of H2O2. * indicates representative LDs. Source data are available for this figure: SourceData F2.

