Figure 4.
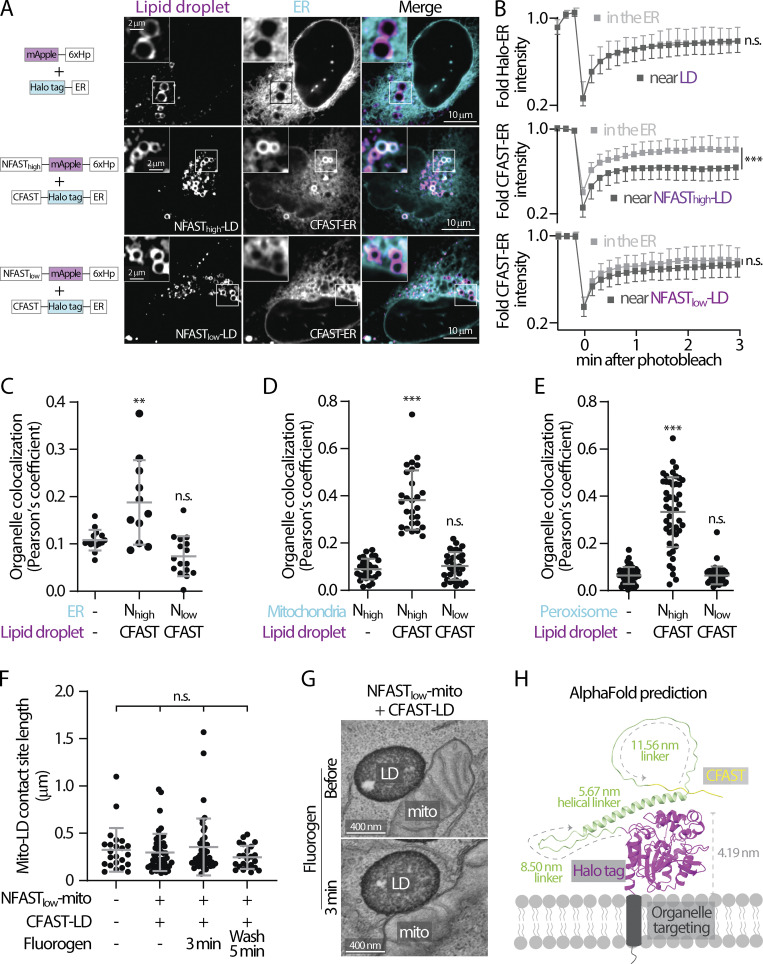
Low affinity splitFAST is suitable for implementing FABCON. (A) Distribution of mApple-6xHp and Halo-ER (top), NFASThigh-mApple-6xHp and CFAST-Halo-ER (middle), and NFASTlow-mApple-6xHp and CFAST-Halo-ER (bottom) in an oleic acid (OA)-treated U2OS cell. Representative images from a single axial plane are shown. (B) Quantification of fluorescence recovery after photobleaching of Halo-ER in the endoplasmic reticulum (ER) and near lipid droplets (LDs); or CFAST-Halo-ER in the ER and near NFASThigh- or NFASTlow-decorated LDs. Mean ± SD is shown (20–25 regions from three independent experiments). n.s. = not significant, ***P ≤ 0.001, unpaired t test, two-tailed. (C) Quantification of the Pearson’s colocalization coefficient of LDs and ER described in A. Raw data and mean ± SD are shown (11–16 cells from three independent experiments). **P ≤ 0.01, assessed by one-way ANOVA. (D) Quantification of the Pearson’s colocalization coefficient of LDs and mitochondria (mito) in cells expressing Halo-6xHp and NFASThigh-mApple-mito, CFAST-Halo-6xHp and NFASThigh-mApple-mito, or CFAST-Halo-6xHp and NFASTlow-mApple-mito (see Fig. S1 A). Raw data and mean ± SD are shown (29–32 cells from three independent experiments). ***P ≤ 0.001, assessed by one-way ANOVA. (E) Quantification of the Pearson’s colocalization coefficient of LDs and peroxisomes described in cells producing Halo-6xHp and PMP34-mApple, CFAST-Halo-6xHp and PMP34-mApple-NFASThigh, or CFAST-Halo-6xHp and PMP34-mApple-NFASTlow (see Fig. S1 B). Raw data and mean ± SD are shown (44–51 cells from three independent experiments). ***P ≤ 0.001, assessed by one-way ANOVA. (F) Quantification of the length of mito-LD contact sites detected by scanning transmission electron microscopy (STEM) in control HeLa cells or cells expressing FABmito-LD in the absence, 3 min after the addition, and 5 min after the washout of 3 µM HBR-2,5DOM. Raw data and mean ± SD are shown (n = 23 in control; n = 50 in Nlow+CFAST without dye; n = 43 in Nlow+CFAST with dye; n = 23 in Nlow+CFAST after washout). n.s. = not significant, assessed by one-way ANOVA. (G) Representative electron micrographs of mito-LD contact sites detected by STEM in HeLa cells expressing FABmito-LD in the absence and presence of 3 µM HBR-2,5DOM for 3 min. (H) AlphaFold structure prediction of CFAST-linker-Halo displayed on a membrane bilayer. The size of Halo tag and length of flexible and helical linkers are indicated.

