Figure 5.
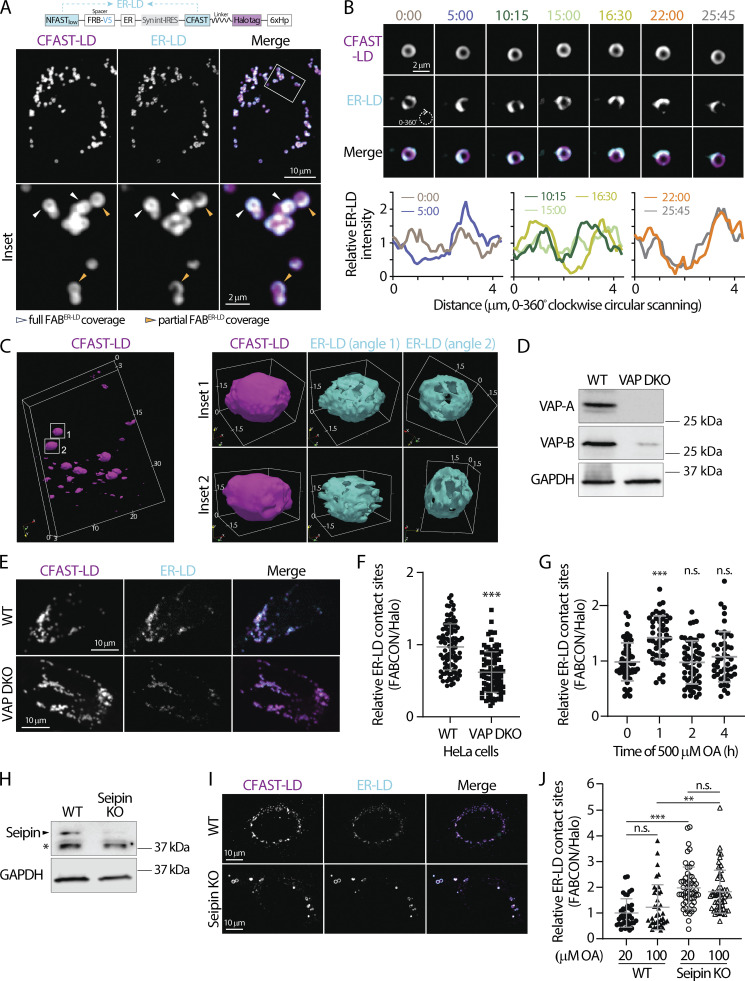
Dynamic regulation of ER-LD contact sites revealed via FABER-LD. (A) Detection of lipid droplets (LDs) and endoplasmic reticulum (ER)-LD contact sites in oleic acid (OA)-treated HeLa cells producing FABER-LD (top) monitored by confocal microscopy. Representative maximal intensity projected images from three axial slices (∼1 µm in total thickness) are shown in bottom panels. (B) Dynamics of ER-LD contact sites on an LD in OA-treated U2OS cell producing FABER-LD monitored by confocal microscopy over time (top). Relative intensity profiles of ER-LD contact sites measured by clockwise circular scanning are shown in bottom panels. (C) 3D rendering of LDs and ER-LD contact site in U2OS cells imaged via LLSM. LDs labeled by CFAST-LD from a whole cell are shown on the left. Box volume is 24.6 × 16.8 × 2.67 µm. Two individual LDs and their ER-LD contact sites are shown on the right. Box volumes are 3.10 × 2.35 × 2.52 µm (top row) and 3.28 × 2.40 × 2.82 µm (bottom row). Numbers indicate distance (µm). (D) Protein levels of VAP-A and VAP-B in wild-type (WT) and VAP double knockout (DKO) HeLa cells detected by Western blot. (E) ER-LD contact sites in WT and VAP DKO HeLa cells producing FABER-LD monitored by confocal microscope. Representative maximal intensity projected images from three axial slices (∼1 µm in total thickness) are shown. (F) Quantification of the relative levels of ER-LD contact sites in control and VAP DKO HeLa cells. Raw data and mean ± SD are shown (96 cells for each condition from three independent experiments) ***P ≤ 0.001, assessed by two-tailed t test. (G) Relative levels of ER-LD contact sites HeLa cells pulsed with 500 μM of OA over time. Raw data and mean ± SD are shown (47–58 cells from three independent experiments). n.s. = not significant, ***P ≤ 0.001, assessed by one-way ANOVA and Dunnett’s multiple comparisons test with 0 h as the control group. (H) Protein level of Seipin in WT and Seipin KO SUM159 cells detected by Western blot. * indicates non-specific band of detection. (I) ER-LD contact sites in oleic acid (OA)-treated WT and Seipin KO SUM159 cells producing FABER-LD monitored using confocal microscopy. Representative maximal intensity projected images from three axial slices (∼1 µm in total thickness) are shown. (J) Relative levels of ER-LD contact sites in WT and Seipin KO SUM159 cells producing FABER-LD and treated with 20 or 100 µM OA overnight. Raw data and mean ± SD are shown (37–55 cells from four independent experiments). n.s. = not significant, ***P ≤ 0.001, assessed by one-way ANOVA. Source data are available for this figure: SourceData F5.

