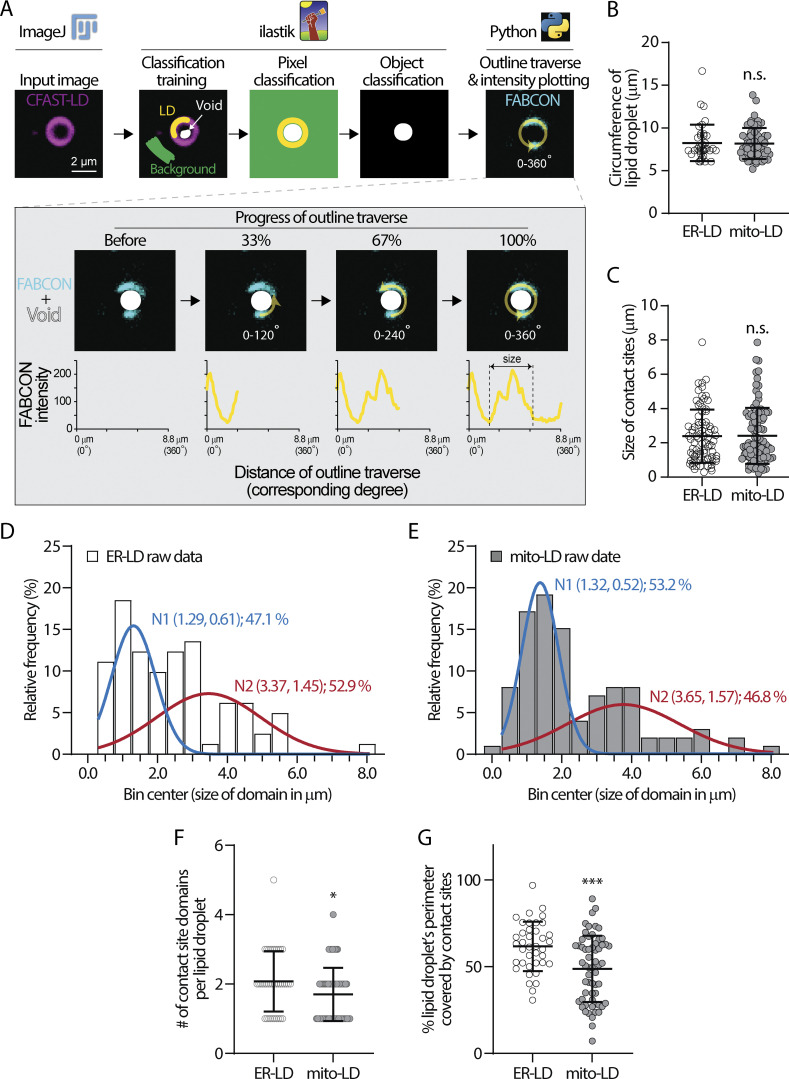
Figure 7.
COSIMA analysis of ER-LD and mito-LD contact sites. (A) A flowchart describing the COSIMA pipeline. (B) Circumference of lipid droplets (LDs) analyzed by COSIMA in the endoplasmic reticulum (ER)-LD and mitochondria (mito)-LD group. Raw data and mean ± SD are shown (39–60 LDs). n.s. = not significant, assessed by two-tailed t test. (C) Size of ER-LD and mito-LD contact sites measured by COSIMA. Raw data and mean ± SD are shown (81–99 contact sites). n.s. = not significant, assessed by two-tailed t test. (D and E) Population distribution of domain size of ER-LD (D) and mito-LD (E) contact sites. Bar graphs show raw data and traces represent fitted bi-modal Gaussian distributions (N). Each N is shown as (mean, SD); % of raw data. (F) Number of ER-LD and mito-LD contact sites on each LD. Raw data and mean ± SD are shown (39–60 LDs). *P ≤ 0.05, assessed by two-tailed t test. (G) Fraction of LD’s perimeter covered by ER-LD and mito-LD contact sites. Raw data and mean ± SD are shown (39–60 LDs). ***P ≤ 0.001, assessed by two-tailed t test.

