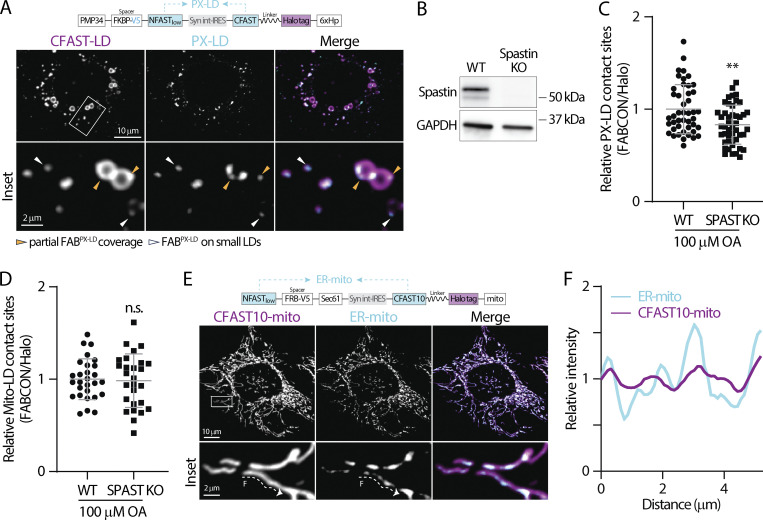
Figure 8.
Detection of PX-LD and ER-mito contact sites using FABCON. (A) Detection of lipid droplets (LDs) and peroxisome (PX)-LD contact sites in oleic acid (OA)-treated U2OS cells producing FABPX-LD (top) monitored via confocal microscopy. Representative maximal intensity projected (MIP) images from three axial slices (∼1 µm in total thickness) are shown. (B) Spastin (SPAST) protein levels from wild-type (WT) and SPAST knockout (KO) U2OS cells detected by Western blot. (C) Relative levels of PX-LD contact sites in WT and SPAST KO U2OS cells. Raw data and mean ± SD are shown (45 cells for each condition from three independent experiments, **P ≤ 0.01, unpaired t test, two-tailed). (D) Relative levels of mitochondria (mito)-LD contact sites in WT and SPAST KO U2OS cells. Raw data and mean ± SD are shown (26–24 cells from three independent experiments, n.s. = not significant, unpaired t test, two-tailed). (E) Detection of endoplasmic reticulum (ER)-mito contact sites in HeLa cells producing FABER-mito (top) monitored by confocal microscopy. Representative MIP images from three axial slices (∼1 µm in total thickness) are shown. (F) Intensity profiles of CFAST10-mito and ER-mito from the dashed line in E. Source data are available for this figure: SourceData F8.

