Figure S1.
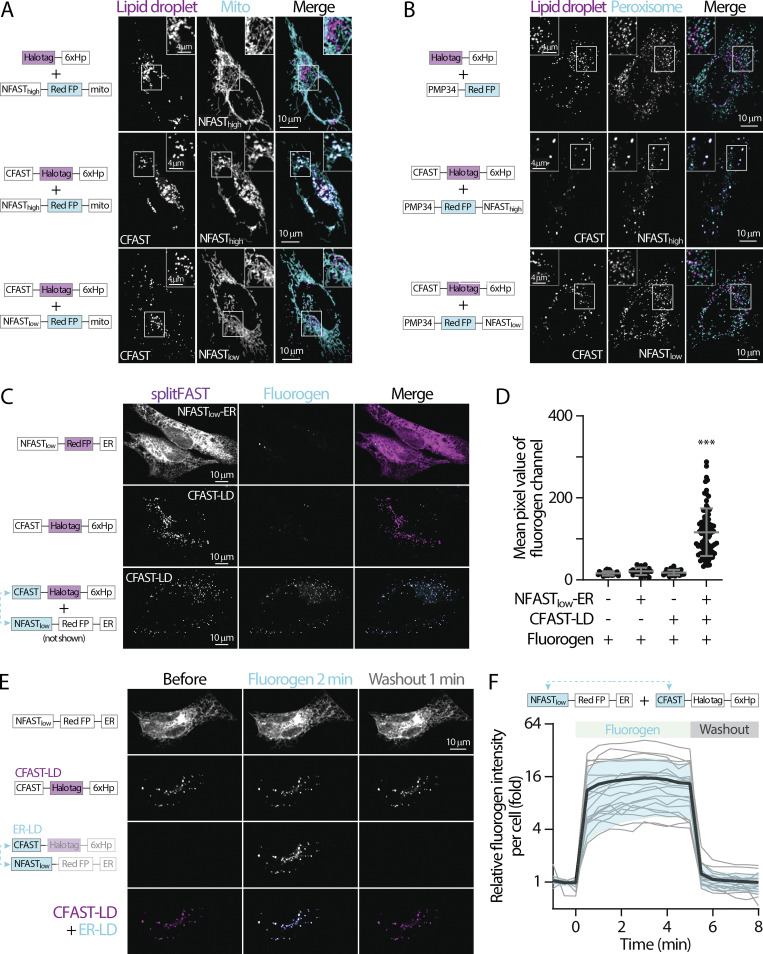
splitFAST remains reversible at organelle contact sites without detectable fluorescence leakiness. (A) Distribution of lipid droplets (LDs) and mitochondria (mito) in oleic acid (OA)-treated HeLa cells overexpressing Halo-6xHp and NFASThigh-mApple-mito, CFAST-Halo-6xHp and NFASThigh-mApple-mito, or CFAST-Halo-6xHp and NFASTlow-mApple-mito monitored using confocal microscopy. Maximal intensity projected images from six axial slices (1.8 µm in total thickness) are shown. (B) Distribution of LDs and peroxisomes in OA-treated HeLa cells overexpressing Halo-6xHp and PMP34-mApple, CFAST-Halo-6xHp and PMP34-mApple-NFASThigh, or CFAST-Halo-6xHp and PMP34-mApple-NFASTlow. (C) Confocal images of HeLa cells expressing NFASTlow-mApple-ER (top), CFAST-Halo-6xHp (middle), and NFASTlow-mApple-ER plus CFAST-Halo-6xHp (bottom) in the presence of HBR-2,5DOM. (D) Quantification of fluorogen intensity of C and in control HeLa cells. Raw data and mean ± SD are shown (22–82 cells). ***P ≤ 0.001, assessed by one-way ANOVA. (E) Distribution NFASTlow-mApple-ER, CFAST-Halo-6xHp, and endoplasmic reticulum (ER)-LD contact site labeled in Hela cells in the absence, 2 min after the addition, and 1 min after the washout of HBR-2,5DOM. (F) Relative fluorogen intensity described in E following HBR-2,5DOM addition and washout monitored by confocal microscopy. Raw data (gray traces) and mean (bold black trace) ± SD (shaded blue) are shown (19 or 20 cells).

