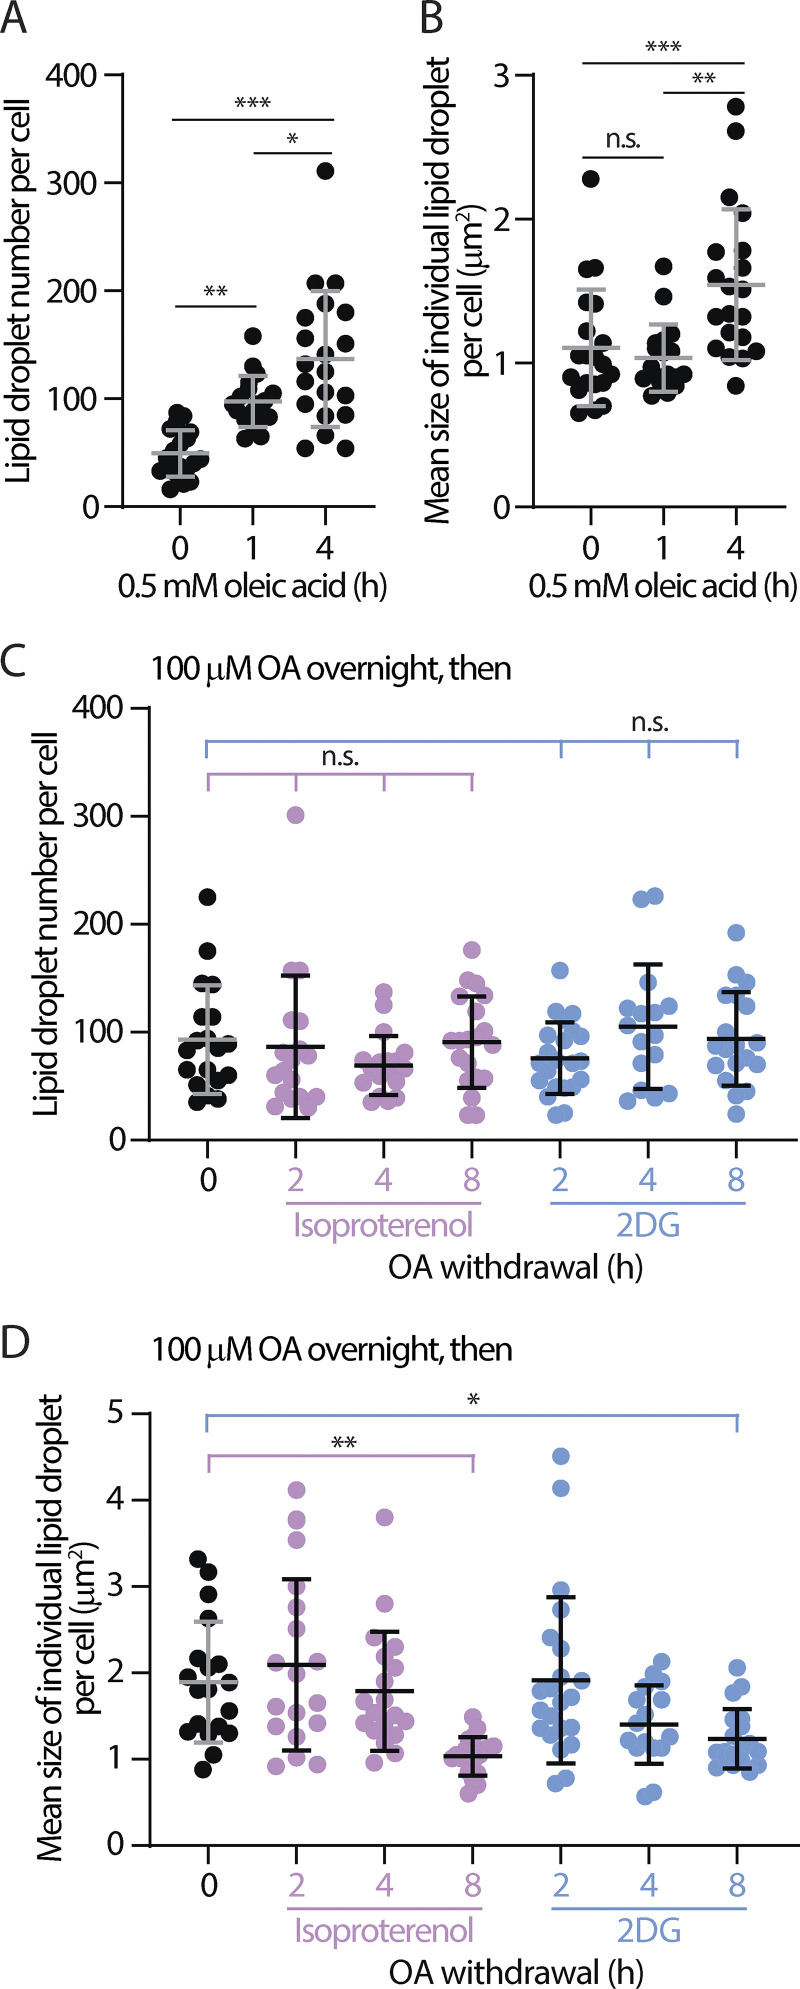
Figure S3.
Number and size of LDs following oleic acid (OA) addition and withdrawal. (A and B) Quantification of lipid droplet (LD) number (A) and size (B) in HeLa cells pulsed with 500 μM of OA over time. Raw data and mean ± SD are shown (18–20 cells from three independent experiments). *P ≤ 0.05, **P ≤ 0.01, ***P ≤ 0.001, assessed by one-way ANOVA and Tukey’s multiple comparisons test. (C and D) Number (C) and size (D) of LDs in OA-treated HeLa cells following OA withdrawal in DMEM and in DMEM with 10 µM of isoproterenol or 4 mM 2DG. Mean ± SD is shown (16–22 cells from three independent experiments). Statistical significance was compared to time zero. n.s. = not significant, *P ≤ 0.05, **P ≤ 0.01, assessed by one-way ANOVA and Tukey’s multiple comparisons test.

