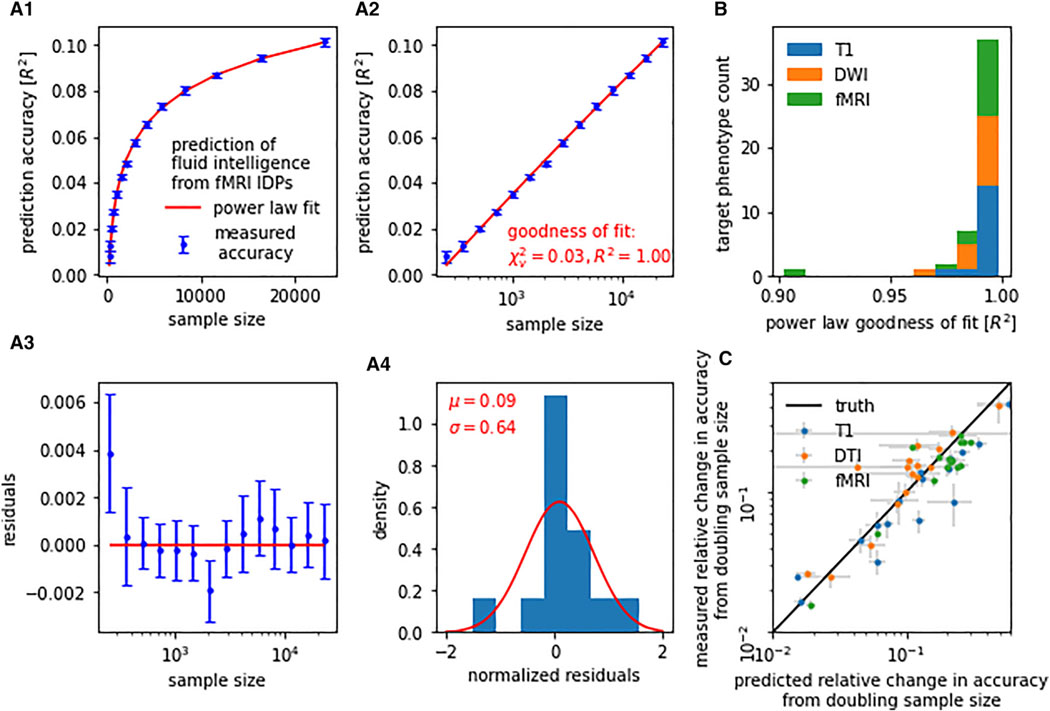
Figure 1. Learning curves for neuroimaging-based phenotype prediction precisely follow a power-law function.
(A) Prediction accuracy scales with the number of training samples. The precise nature of this relationship can be described by a simple power law [α n−β + γ]. (A.1) For instance, when predicting fluid intelligence from rfMRI data using ridge regression, out-of-sample accuracy (blue) closely followed the fitted power law (red). (A.2) We observed stable and continuous improvements in accuracy with increasing sample size, i.e., approximately linear scaling of prediction accuracy with log(n). (A.3 and A.4) Residuals of the power-law fit gave no indication of systematic deviations between measured accuracy and fitted power law.
(B) Power-law scaling was observed in all evaluated prediction tasks (i.e., combinations of imaging modality and target phenotype), with a goodness-of-fit R2 between measured learning curve and power law of on average 0.990 (SD = 0.015, min = 0.902).
(C) Learning curve extrapolation predicted accuracy achievable on unseen larger samples. Shown are projected gains in prediction accuracy derived from learning curve extrapolation on the y axis in relation to observed gains in prediction accuracy on the x axis. Both were derived by doubling the training sample size from 8,000 to 16,000. Error bars indicate standard error of the mean (SEM).

