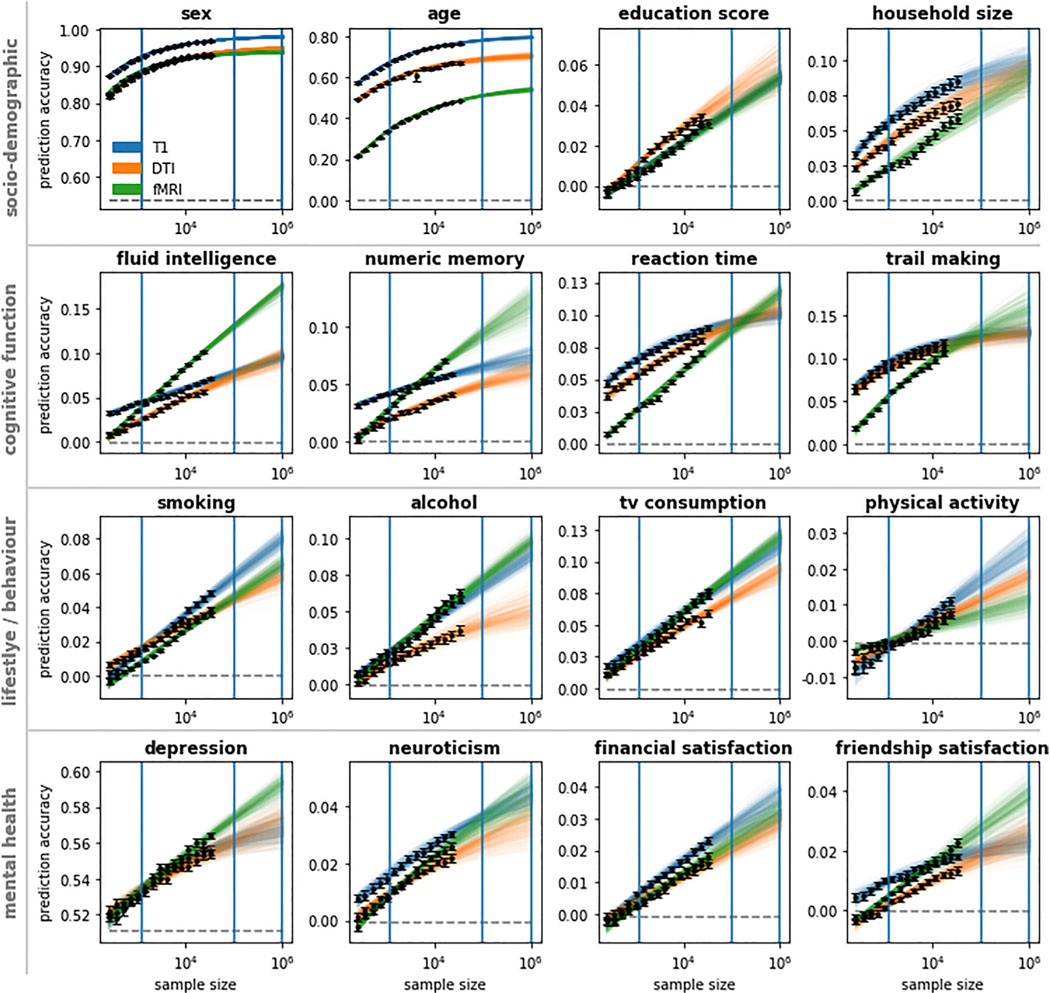
Figure 2. Linear models are operating far below ceiling accuracy for most target phenotype predictions.
Learning curves show the collective results obtained from regularized linear models using T1, DWI, and rfMRI data to predict sociodemographic, cognitive function, behavior/lifestyle, and mental health phenotypes. Training datasets were subsampled from the UK Biobank up to a size of 32,000 participants. Learning curves were extrapolated beyond 32,000 participants. To indicate extrapolation uncertainty, each colored line represents a power-law fit based on a bootstrap sample of observed accuracies. Observed prediction accuracies are marked black; majority classifier/median regression baselines are marked dashed gray. Blue vertical lines indicate the sample size of the Human Connectome Project (1,000), the imaging sample size goal of the UK Biobank (100,000), and the proposed Million Brain Initiative (1 M). Error bars indicate SEM.

