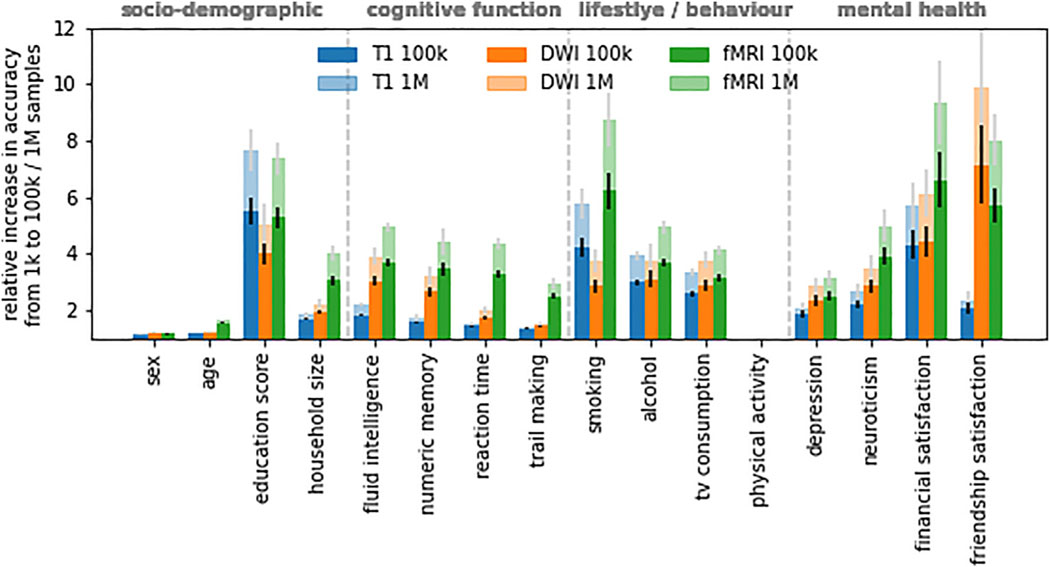
Figure 3. Multifold gains in prediction performance are projected for behavioral and mental health phenotypes when moving from 1,000 to 1 M samples.
Shown is the relative increase in prediction accuracy per modality and target phenotype derived from learning curve extrapolation on regularized linear models. Results for physical activity could not be reliably estimated due to near-zero baseline (cf. Figure 2). Error bars indicate SEM.

