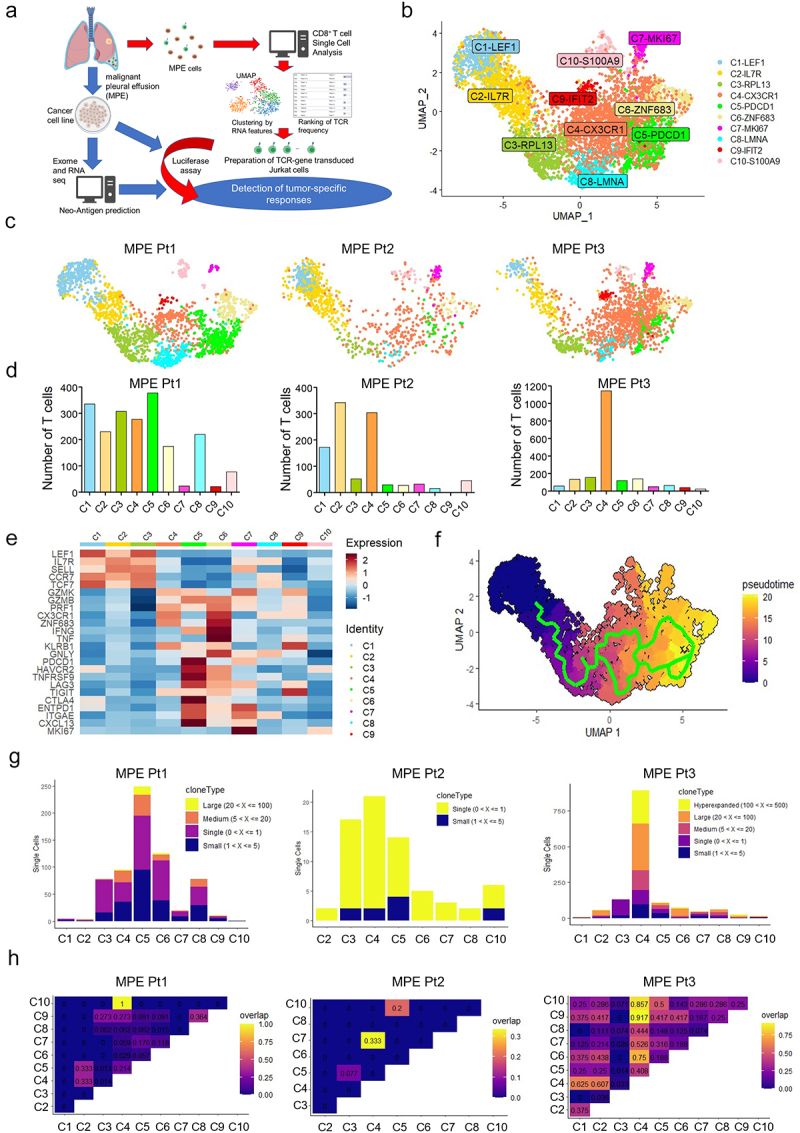
Figure 1.

Phenotypic and TCR clonal analyses of CD8+ T cells from MPE.
a. Overall scheme of this study. Schema prepared with BioRender.com. b. Uniform manifold approximation and projection (UMAP) of the expression profiles of the 4,983 single CD8+ T cells derived from the 3 MPE. CD8+ T cells are classified into 10 distinct clusters. c. UMAPs of CD8+ T cells in each patient. d. The number of T cells in the 10 clusters of each patient. e. The normalized average expression of phenotypic and functional signatures for CD8+ T cell subpopulations defined in B. f. Pseudotime trajectory analysis of 4,983 CD8+ T cells. Each dot represents one single cell and each cell with a pseudotime score from dark blue to yellow, indicating early and terminal states, respectively. g. Clonality and clone numbers in each cluster for the three patients. h. The rate of overlapping clonotypes among different clusters.
