
Figure 3.
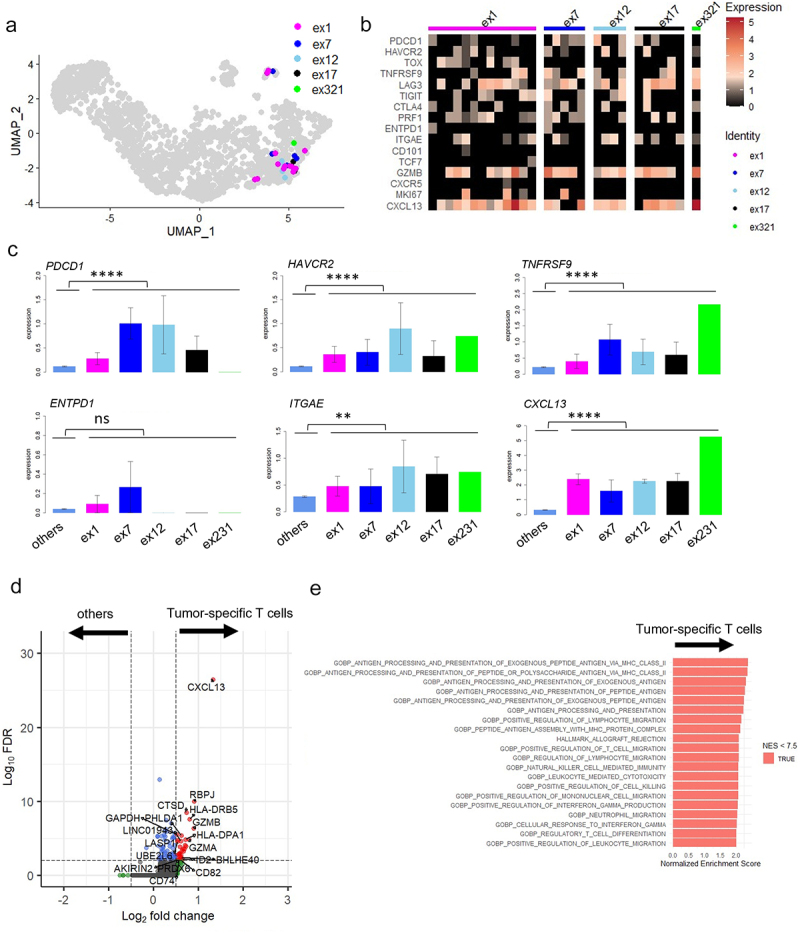
Gene expression analysis of tumor-specific CD8+ T cells from MPE.
a. All identified TCR clones (n = 29) with the five tumor-antigen specific TCRs (ex1, ex7, ex12, ex17, and ex321) were projected onto UMAPs. b. Expression of exhaustion-related genes in each tumor-specific T cell clone. c. Expression of representative genes in tumor-specific T cells expressing different TCRs compared with the other T cells. Comparison of average expressions of tumor-specific T cells and the others was performed using Mann–Whitney U-test. d. Analysis of genes differentially expressed between tumor-specific T cells and other T cells. Volcano plot showing differentially expressed genes with adjusted p value < .01 and log2FC >0.5. e. Fast Gene set enrichment analysis (FGSEA) of tumor-specific T cells and others. The top 20 significant gene sets with adjusted p value < .01 and NES < 7.5 are shown. *, P < .05; **, P < .01; ***, P < .001; ****, P < .0001; ns, not statistically significant.