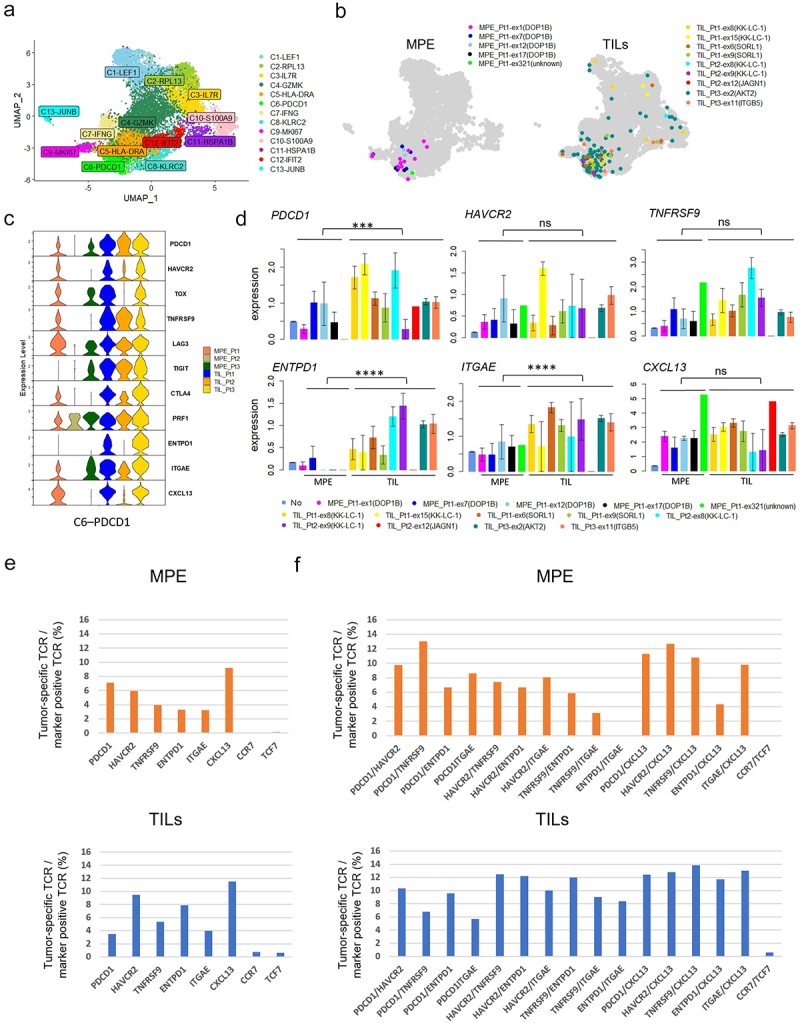
Figure 4.

Comparison of tumor specific CD8+ T cells between MPE and TILs.
a. UMAP of the expression profiles of the 11,981 (MPE: 4,983 cells + TILs: 6,998 cells) single CD8+ T cells derived from 3 MPE and 3 TILs.18 CD8+ T cells are classified into 13 distinct transcriptional clusters. b. All tumor-specific TCR clones with the five tumor-specific TCRs from MPE (left) and nine tumor-specific TCRs from TIL (right) were projected onto UMAPs. c. Violin plot showing the expression of representative genes in cluster C6-PDCD1 for 3 MPE and 3 TILs. d. Comparison of the expression of T cell subset-defining genes in tumor-specific T cells expressing TCRs different between MPE and TILs. Comparison of average expressions of tumor-specific T cells from MPE and TILs was performed using Mann-Whitney U-test. E and F. The ratio of tumor-specific T cells in T cell populations expressing a single marker gene (e) or a combination of marker genes (f) in MPE and TILs. *, p < .05; **, p < .01; ***, p < .001; ****, p < .0001; ns, not statistically significant.
