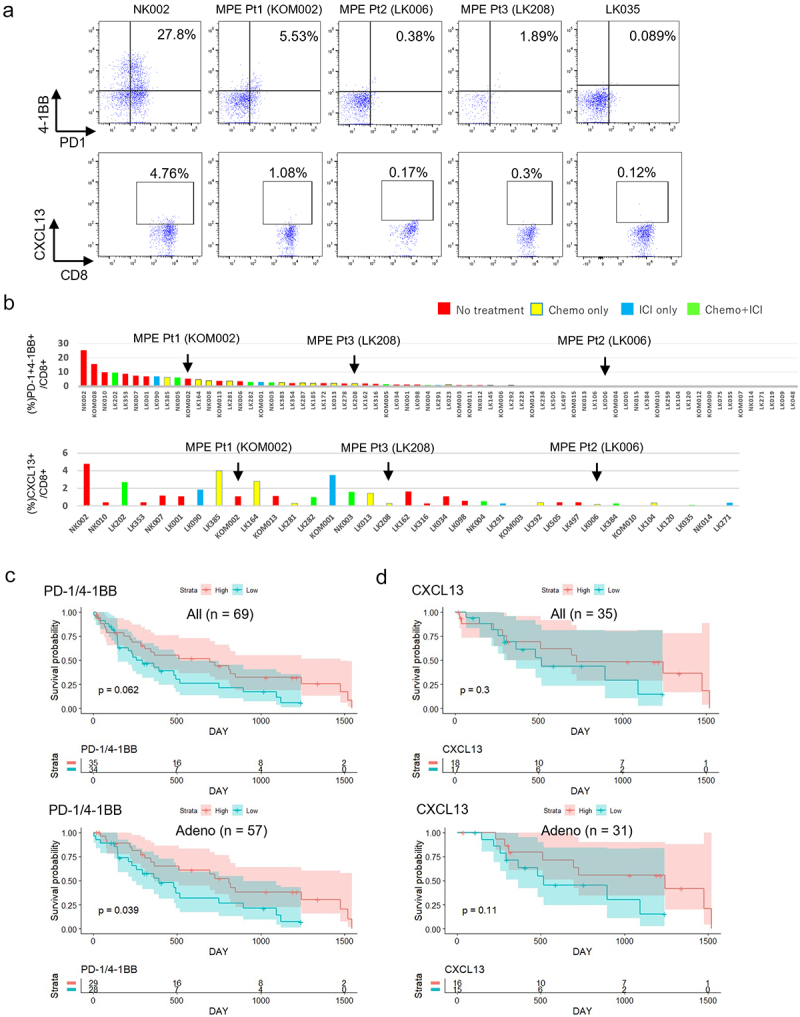
Figure 5.

Associations of tumor specific CD8+ T cell fractions in MPE with patients’ prognosis.
a. The expression of PD-1/4-1BB and CXCL13 by CD8+ T cells analyzed by flow cytometry in 69 and 35 patients, respectively, showing higher and lower percentages of their expression for 3 MPE patients (MPE Pt1, MPE Pt2, MPE Pt3). b. Flow cytometric analyses of all patients are shown as bar graphs. c and d. Kaplan–Meier survival curves for patients stratified into two groups by the median values of the expression of PD-1/4-1BB (c) or CXCL13 (d) in all patients and in a subgroup of adenocarcinoma patients.
