FIG. 5.
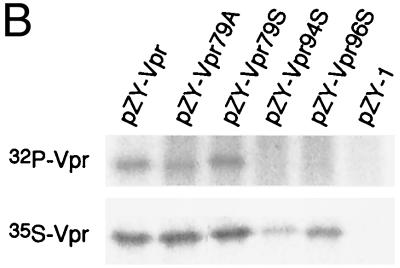
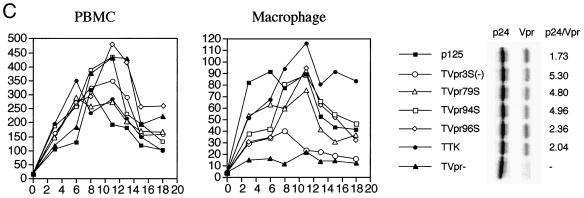
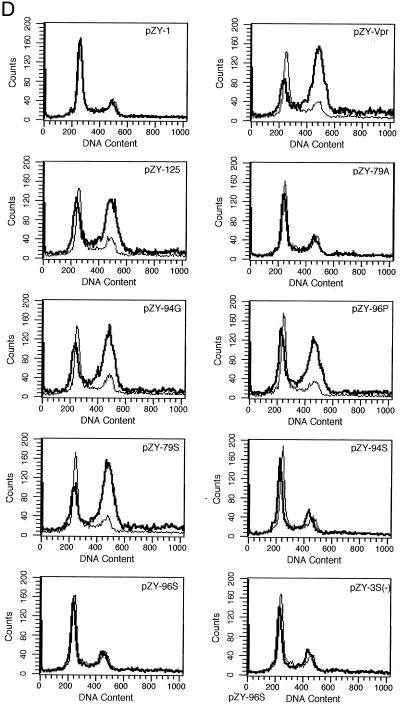
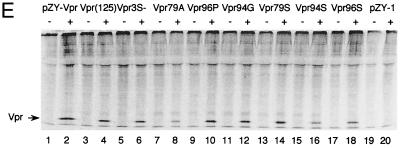
Phosphorylation and Vpr biological functions. (A) Mutant Vpr sequences in the p125-TTK proviral construct. Numbers above the p125 sequence show serine positions; each serine is underlined. +, Vpr is phosphorylated; −, Vpr is not phosphorylated; ND, not done. The data shown in the G2 arrest column represent the ratio of G1/(G2/M) with inducer to G1/(G2/M) without inducer. The data are the averages from two independent experiments. Vpr protein stability, shown in the T1/2 (half-life, in hours) column, is the average of two independent experiments. (B) Both 32P- and 35S-labeled forms of Vpr were detected as described in Materials and Methods and indicated by arrows on the left. (C) PBMC and macrophage infections by the mutant p125 viruses shown in panel A. The p24 volume is from the average of two different clones of the same mutant. The ratio of p24 to Vpr from the immunoprecipitation was determined by phosphorimager using the Multi-Analyst 1.0.1 program (Bio-Rad) and normalized to the amount of Met/Cys in p24 (11 of total Met/Cys) and Vpr (2 of total Met/Cys) by dividing the p24 counts by 6.5. The data represent the average of two independent experiments. (D) FACscan analysis profiles from one of the two independent experiments. The thick and thin lines represent the presence and absence of the inducer, muristerone A, respectively. The average G2 cell cycle arrest result is also shown in panel A. (E) Vpr and mutant proteins were detected by immunoprecipitation of the 35S-labeled cells in the absence (−) or presence (+) of muristerone A.


