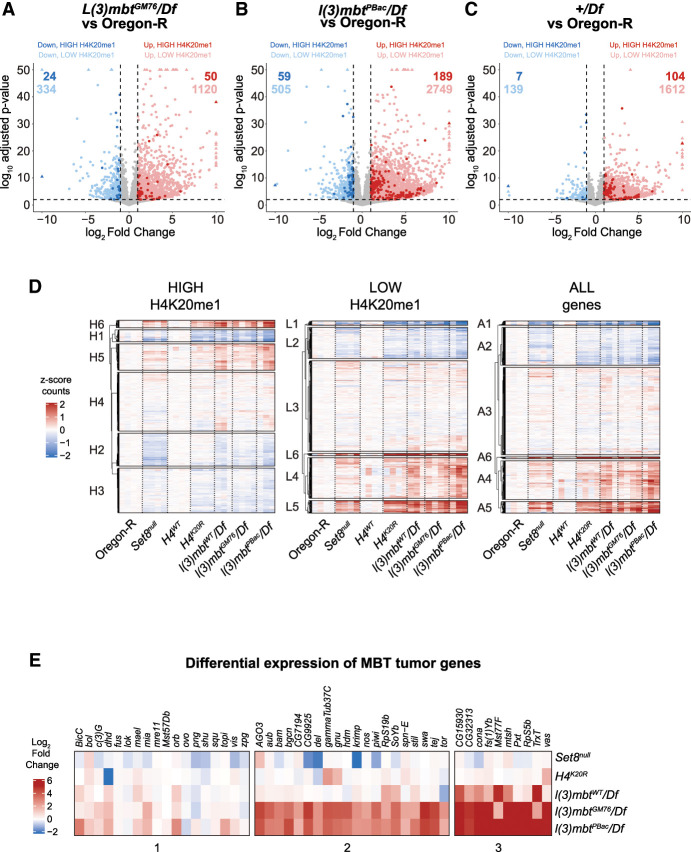
Figure 5.
l(3)mbt, Set8, and H4K20R transcriptomes are similar. (A–C) Volcano plots depicting the relationship between log2FC (x-axis) and log10 adjusted P-value (y-axis) of gene expression in the indicated comparisons. Blue dots indicate significantly downregulated genes (log2FC < −1 and FDR < 0.01), and red dots indicate significantly upregulated genes (log2FC > 1 and FDR < 0.01). Darker-shaded dots indicate genes in the high H4K20me1 category. (D) Clustered heat maps of average centered normalized counts in the indicated genotypes. (E) Heat map of log2FC values of the indicated genotypes for genes involved in MBT formation (Janic et al. 2010).

