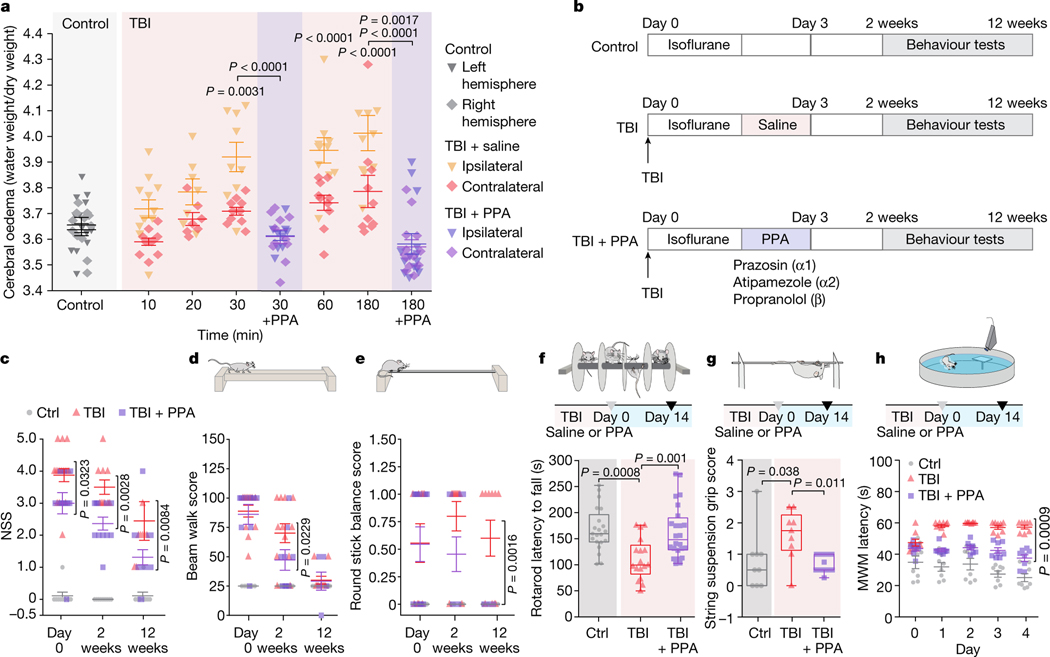
Fig. 1 |. Pan-adrenergic receptor inhibition eliminates oedema and improves functional outcomes after TBI.
a, The kinetics of cerebral oedema in the mouse brain with or without TBI and PPA treatment (n = 81 mice) was quantified in ipsilateral (triangles) and contralateral (diamonds) hemispheres at 0 min (n = 12), 10 min (n = 11), 20 min (n = 7), 30 min (n = 9), 60 min (n = 10) and 180 min (n = 10) after injury. Statistical analysis was performed using two-way analysis of variance (ANOVA) (F7,146 = 19.55, P < 0.0001) with Tukey’s multiple-comparison test in the ipsilateral hemispheres (control (ctrl) versus 30, 60 and 180 min, P = 0.0031, P < 0.0001 and P < 0.0001, respectively) and contralateral hemisphere (control versus 180 min, P = 0.0107); ipsilateral versus contralateral hemisphere comparisons: 30 min (P = 0.003), 60 min (P = 0.003) and 180 min (P = 0.0007); TBI + saline and TBI + PPA treatment comparison: 30 min (n = 9 mice each; ipsilateral, P < 0.0001; contralateral, P = 0.812) and 180 min (n = 10 and 13 mice, respectively; ipsilateral, P < 0.0001; contralateral, P = 0.0017). b, Experimental schematic for behavioural assessment. c–e, Neurological severity score (c; NSS). n = 97 mice. Statistical analysis was performed using two-way ANOVA (F2,88 = 2.88, P < 0.0001) with Tukey’s multiple-comparison test: TBI + saline versus TBI + PPA, P = 0.0323 (n = 12 each), P = 0.0028 (n = 12 each) and P = 0.0084 (n = 10 and 12, respectively) at day 0 and after 2 and 12 weeks, respectively. d,e, Performance in the beam walk (d) and round stick balance (e) tests. f, Rotarod falling latency at 2 weeks after TBI with or without PPA treatment compared with the non-injured control. n = 62 mice. Statistical analysis was performed using one-way ANOVA (F2,59 = 9.006, P < 0.0001) with Tukey’s multiple-comparison test: control (n = 21) versus TBI + saline (n = 17) (P = 0.0008); TBI + saline (n = 17) versus TBI + PPA (n = 24) (P = 0.001). g, String suspension grip scores. n = 31 mice. Statistical analysis was performed using one-way ANOVA (F2,28 = 5.43, P < 0.0001) with Tukey’s multiple-comparison test: TBI + saline (n = 9) versus TBI + PPA (n = 13) (P = 0.0114). h, The Morris water maze (MWM) test was performed at 2 weeks after TBI. n = 24 mice. Statistical analysis was performed using two-way ANOVA (F8,105 = 3.625, P < 0.0001) with Tukey’s multiple-comparison test: TBI + saline versus TBI + PPA (P = 0.0009). Data are mean ± s.e.m. (a, c–e and h). Box plots show the lower and upper quartiles (box limits), median (centre line) and minimum to maximum values (whiskers).

