
Extended Data Fig. 4 |. Post-TBI noradrenergic receptor inhibition reduces astrocytic hypertrophy, microglial invasion, and subsequent hyper-phosphorylation of tau.
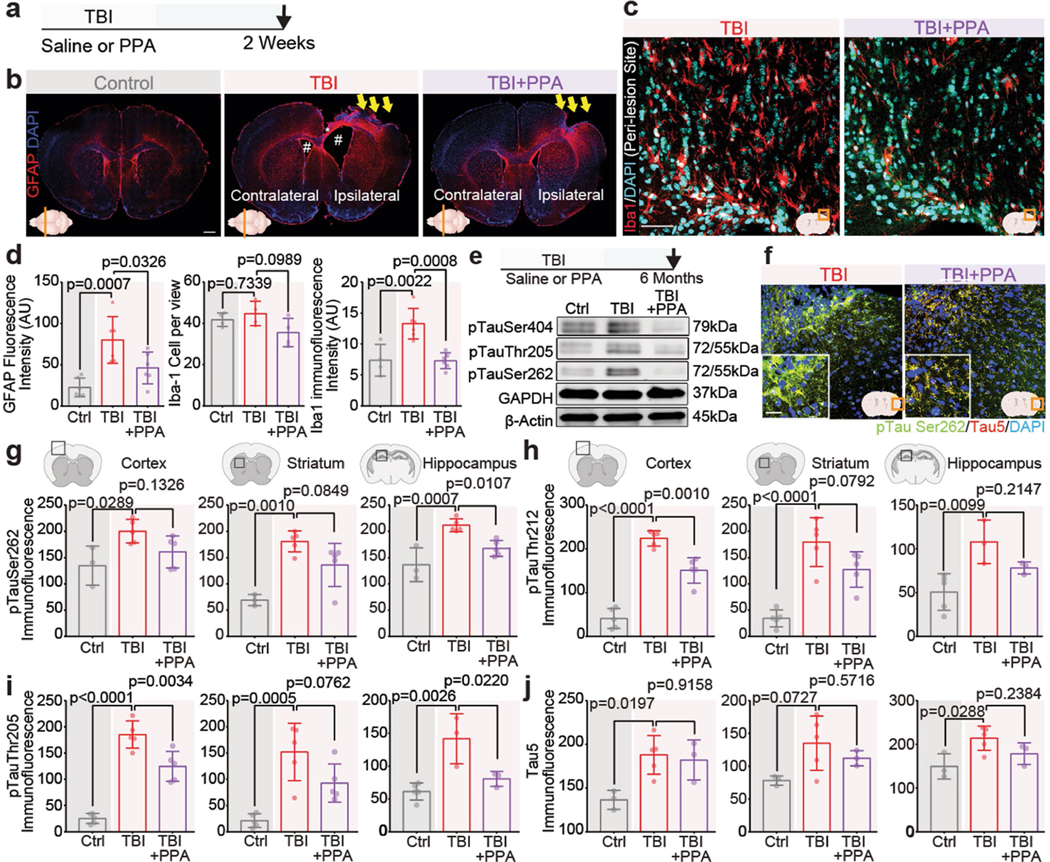
a, Schematic showing induction of injury followed by a two-week experimental window. b, Coronal sections of mouse brain showing the lesion centre were immunostained for GFAP (red) and DAPI (blue); the site of injury/damaged somatosensory cortex, enlarged ventricles both on ipsilateral and contralateral sides, and the white matter tract corpus callosum are indicated by yellow arrows, white # symbols, and a white * sign, respectively, in non-injury control, TBI, and TBI + PPA slices. c, Brain sections (bregma; AP −0.8 to 2 mm) were immunostained for microglia (Iba-1, red) and pan-nuclear marker (DAPI, blue); the bottom right corner shows the region of interest. d, Quantification of immunofluorescence of GFAP (n = 18 mice, 6 mice/group, multiple slices averaged per mouse, one-way ANOVA, F2,15 = 11.6, p = 0.0009, Tukey’s multiple comparison test; Control vs TBI-saline, p = 0.0007, TBI-saline vs TBI + PPA, p = 0.033), number of microglia (n = 12 mice, 4 mice/group, multiple slices averaged per mouse, one-way ANOVA, F2,9 = 2.879, p = 0.108) and Iba-1 immunostaining (n = 16 mice; Control (n = 4), TBI-saline (n = 6), TBI + PPA (n = 6), multiple slices averaged per mouse, one-way ANOVA, F2,13 = 14.89, p = 0.0004, Tukey’s multiple comparison test; Control vs TBI-saline, p = 0.0022; TBI-saline vs TBI + PPA, p = 0.0008). e, (Top) Schematic showing the experimental time window of western blot and immunohistochemistry experiments for detection of hyper-phosphorylation of tau protein. (Bottom) Western blot analysis was performed in whole brain homogenates for tau targets: pTauSer404, pTauThr205, and pTauSer262 (n = 3 biological replicates/mice). f, Representative images showing hyper-phosphorylation of tau at site Ser262, Tau5, and DAPI in separate sets of mice at six months after TBI, with or without NA pan-adrenergic receptor blockade. g-j, Quantification of immunostaining of pTau in the cortex, striatum, and hippocampus for targets. g, pTauSer262 (n = 13 mice; Control (n = 3), TBI-saline (n = 5), TBI + PPA (n = 5), multiple slices averaged per mouse, one-way ANOVA followed by Tukey’s multiple comparison test where applicable), Cortex: F2,10 = 5.122, p = 0.0294; Control vs TBI-saline, p = 0.029, TBI-saline vs TBI + PPA, p = 0.133, Striatum: F2,10 = 13.7, p = 0.0014; Control vs TBI-saline, p = 0.0010, TBI-saline vs TBI + PPA, p = 0.085, Hippocampus: F2,10 = 15.92, p = 0.0008; Control vs TBI-saline, p = 0.0007, TBI-saline vs TBI + PPA, p = 0.011. h, pTauT212 (n = 15 mice, 5 mice per group, multiple slices averaged per mouse, one-way ANOVA followed by Tukey’s multiple comparison test where applicable), Cortex: F2,12 = 75.42, p < 0.0001; Control vs TBI-saline, p < 0.0001, TBI-saline vs TBI + PPA, p = 0.001, Striatum: F2,12 = 22.89, p < 0.0001; Control vs TBI-saline, p < 0.0001, TBI-saline vs TBI + PPA, p = 0.079, Hippocampus: n = 11 mice, Control (n = 5), TBI-saline (n = 3), TBI + PPA (n = 3), multiple slices averaged per mouse, F2,8 = 8.088, p = 0.0120; Control vs TBI-saline, p = 0.0099, TBI-saline vs TBI + PPA, p = 0.215. i, pTauThr205 (n = 15 mice, 5 mice per group, multiple slices averaged per mouse, one-way ANOVA followed by Tukey’s multiple comparison test where applicable), Cortex: F2,12 = 62.05, p < 0.0001; Control vs TBI-saline, p < 0.0001, TBI-saline vs TBI + PPA, p = 0.0034, Striatum: F2,12 = 14.37, p = 0.0007; Control vs TBI-saline, p = 0.0005, TBI-saline vs TBI + PPA, p = 0.076, Hippocampus: n = 11 mice, Control (n = 5), TBI-saline (n = 3), TBI + PPA (n = 3), multiple slices averaged per mouse, F2,8 = 12.94, p = 0.0031; Control vs TBI-saline, p = 0.0026, TBI-saline vs TBI + PPA, p = 0.022. j, Tau5 (n = 11 mice, Control (n = 3), TBI-saline (n = 5), TBI + PPA (n = 3), multiple slices averaged per mouse, one-way ANOVA followed by Tukey’s multiple comparison test where applicable), Cortex: F2,8 = 6.605, p = 0.020; Control vs TBI-saline, p = 0.019, TBI-saline vs TBI + PPA, p = 0.915, Striatum: F2,8 = 3.39, p = 0.086; Control vs TBI-saline, p = 0.073, TBI-saline vs TBI + PPA, p = 0.571, Hippocampus: F2,8 = 5.412, p = 0.0326; Control vs TBI-saline, p = 0.029, TBI-saline vs TBI + PPA, p = 0.24. Data shown as bar charts of mean and SEM, bars show mean and SEM, and the dots are biological replicates/mice. Scale: (b) 250 μm, (c) 50 μm, (f) 25 μm.