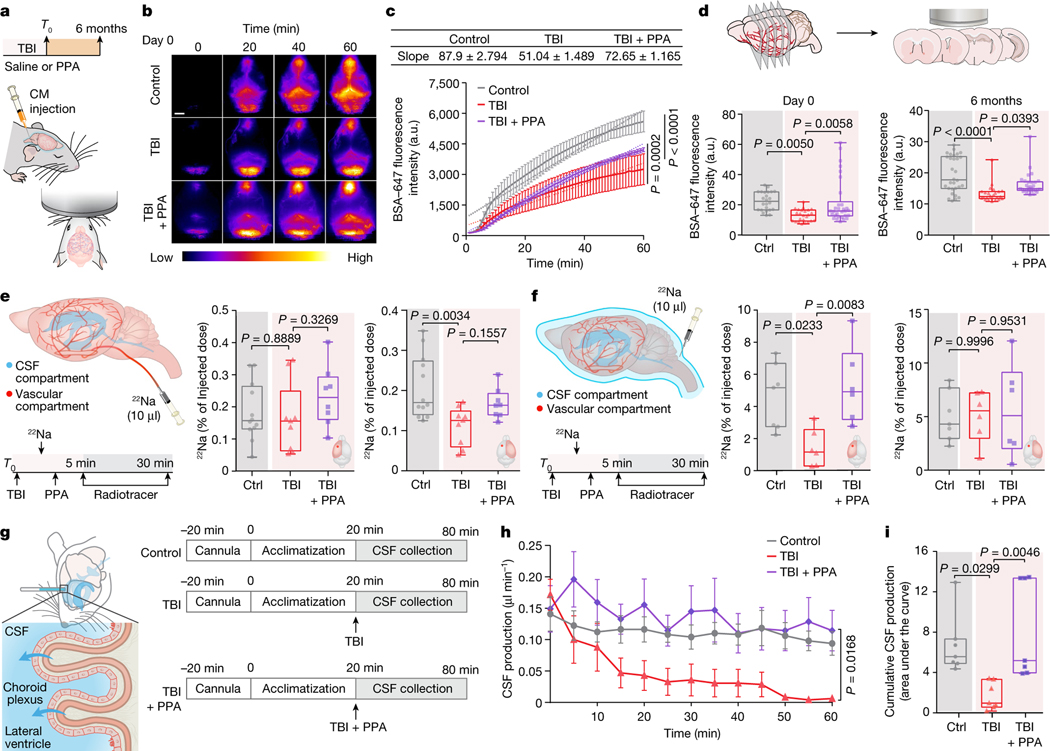
Fig. 2 |. Post-TBI suppression of glymphatic efflux is counteracted by pan-adrenergic inhibition.
a, Schematic of fluorescent tracer injection with or without TBI and PPA treatment. CM, cisterna magna. b,c, Transcranial time-lapse imaging (b) and quantification (c) of Alexa-fluor-647-conjugated BSA tracer (BSA–647). n = 15 mice, 5 mice per group, 60 timepoints. Statistical analysis was performed using linear regression and two-way ANOVA (F2,488 = 191.8, P < 0.0001) with Tukey’s multiple-comparison test; values are indicated on the graph. d, The mean pixel intensity of BSA–647 in brain slices. Group means were compared using one-way ANOVA with Tukey’s multiple-comparison test; values are indicated on the graph. Day 0 (n = 78 brain slices, 5 biological replicates/mice; F2,75 = 6.77, P = 0.002) and 6 months after TBI (n = 84 brain slices; 7 (30 slices), 3 (24 slices) and 5 (30 slices) biological replicates/mice in the control, TBI + saline and TBI + PPA groups, respectively; F2,81 = 14.11, P < 0.0001). e, Schematic of the injection of the radiotracer 22Na into the vascular compartment of the brain; radioactivity is shown as the percentage of the injected dose. n = 29 biological replicates/mice (12 control, 9 TBI + saline and 8 TBI + PPA). Ipsilateral: F2,26 = 1.122, P = 0.3408; contralateral: F2,26 = 6.577, P = 0.0049. f, Schematic of the CSF compartment. 22Na was injected into the cisterna magna and radioactivity is shown as the percentage of the injected dose. n = 19 biological replicates/mice (7 control, 6 TBI + saline and 6 TBI + PPA). Ipsilateral: F2,16 = 6.97, P = 0.0067; contralateral: F2,16 = 0.0656, P = 0.9367. For e and f, group means were compared using one-way ANOVA with Tukey’s multiple-comparison test; values are indicated on the graph. g, Schematic of CSF production measurement in the lateral ventricles. h,i, Quantification of time-lapsed CSF production (h) (n = 21 biological replicates/mice, 7 per group, 13 timepoints; F12,233 = 2.429, P = 0.0054) and cumulative CSF production/area under the curve (i) (F2,18 = 7.393, P = 0.0045). Group means were compared using one-way (i) or two-way (h) ANOVA with Tukey’s multiple-comparison test; values are indicated on the graph. For c and h, data are mean ± s.e.m. Box plots show lower and upper quartiles (box limits), median (centre line) and minimum to maximum values (whiskers); dots are biological replicates/mice. For b, scale bar, 2.5 mm.

