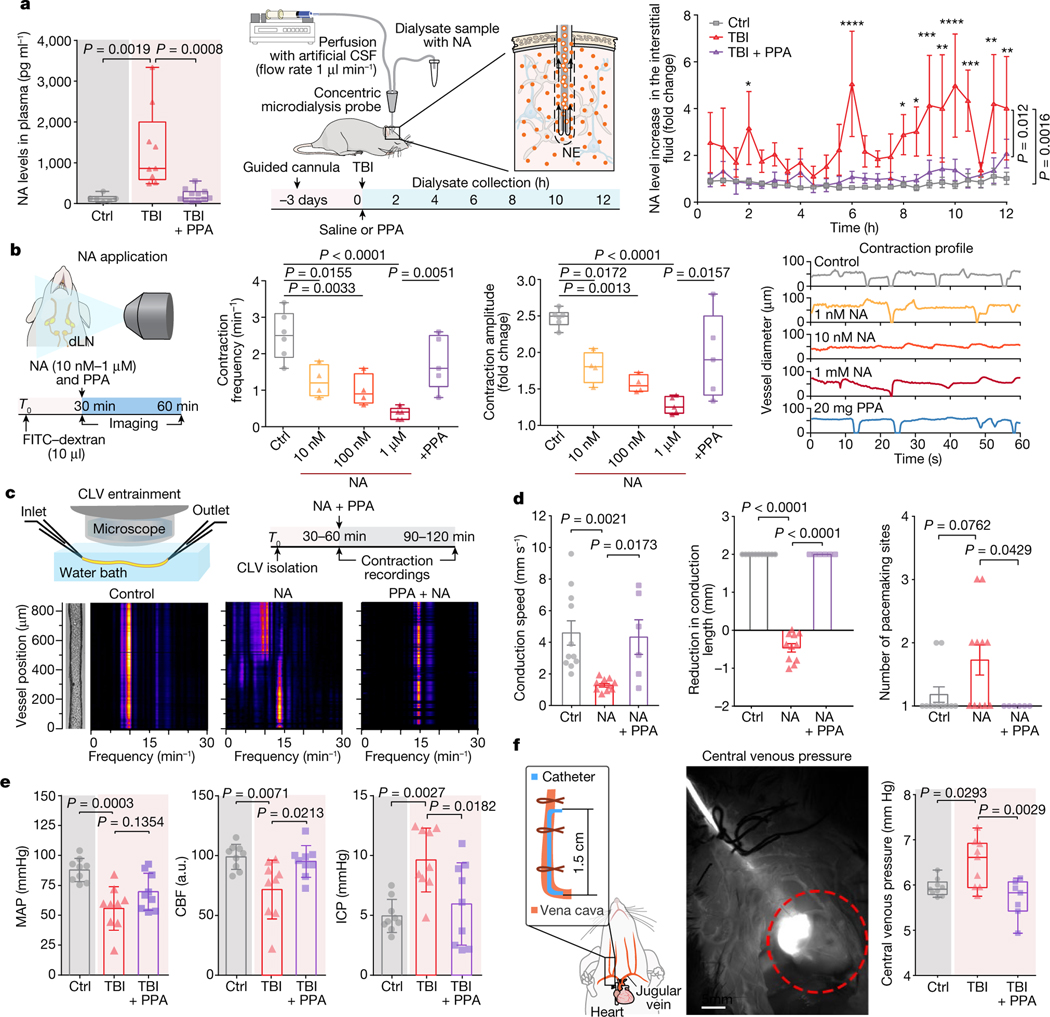
Fig. 4 |. Noradrenergic storm after TBI disrupts contraction wave entrainment but is prevented by PPA treatment.
a, NA levels in the plasma within 10 min of injury. n = 26 biological replicates/mice (6 control, 9 TBI + saline and 11 TBI + PPA; F2,23 = 11.67, P = 0.0003) (left). Middle, schematic of CSF sampling by microdialysis. Right, NA levels in the interstitial space. n = 15 biological replicates/mice (7 control, 4 TBI + saline and 4 TBI + PPA; F2,12 = 11.26, P = 0.0018). b, In vivo recording of contraction frequencies under various conditions; control (n = 6 mice), 10 and 100 nM (n = 4 mice each), 1 μM and PPA (n = 5 mice each). Frequencies (F4,19 = 11.89, P < 0.0001), amplitudes (F4,19 = 12.25, P < 0.0001) and representative contraction profiles with or without NA and PPA are shown. c, Schematic of the set-up used for ex vivo recording of the cervical lymphatic vessel contraction pattern and the experimental timeline (top). Bottom left, image of an isolated, pressurized superior cervical lymphatic vessel with the corresponding fast Fourier transform map. Bottom right, fast Fourier transform maps of vessels with PPA pretreatment (10 ng ml−1) before NA administration. d, Conduction and pacemaking parameters of cervical lymphatic vessels with or without NA and PPA. n = 28 vessels/mice (11 control, 11 NA and 6 NA + PPA). The conduction speed (F2,25 = 8.45, P = 0.0016), the conduction length (F2,25 = 375.5, P < 0.0001) and the number of pace-making sites (F2,25 = 4.174, P = 0.0273) are shown. e, Measurements (n = 27 biological replicates/mice, 9 per group) of MAP (F2,24 = 10.56, P = 0.0005), CBF (F2,24 = 6.613, P = 0.0052) and intracranial pressure (ICP, F2,24 = 7.847, P = 0.002). f, Central venous pressure was recorded using a jugular vein catheter (n = 25 mice; 9 control, 9 TBI + saline and 7 TBI + PPA; F2,22 = 7.762, P = 0.0028). Group means were compared using one-way (a (left), b and d–f) or two-way (a (right)) ANOVA followed by Bonferroni’s (a (left)) or Tukey’s (a (right), b and d–f) multiple-comparison tests; values are indicated on the graphs. Data are group means ± s.e.m. (a) and mean ± s.e.m. (d and e). Box plots show the lower and upper quartiles (box limits), median (centre line) and minimum to maximum values (whiskers); dots show biological replicates/mice. Scale bar, 5 mm.

