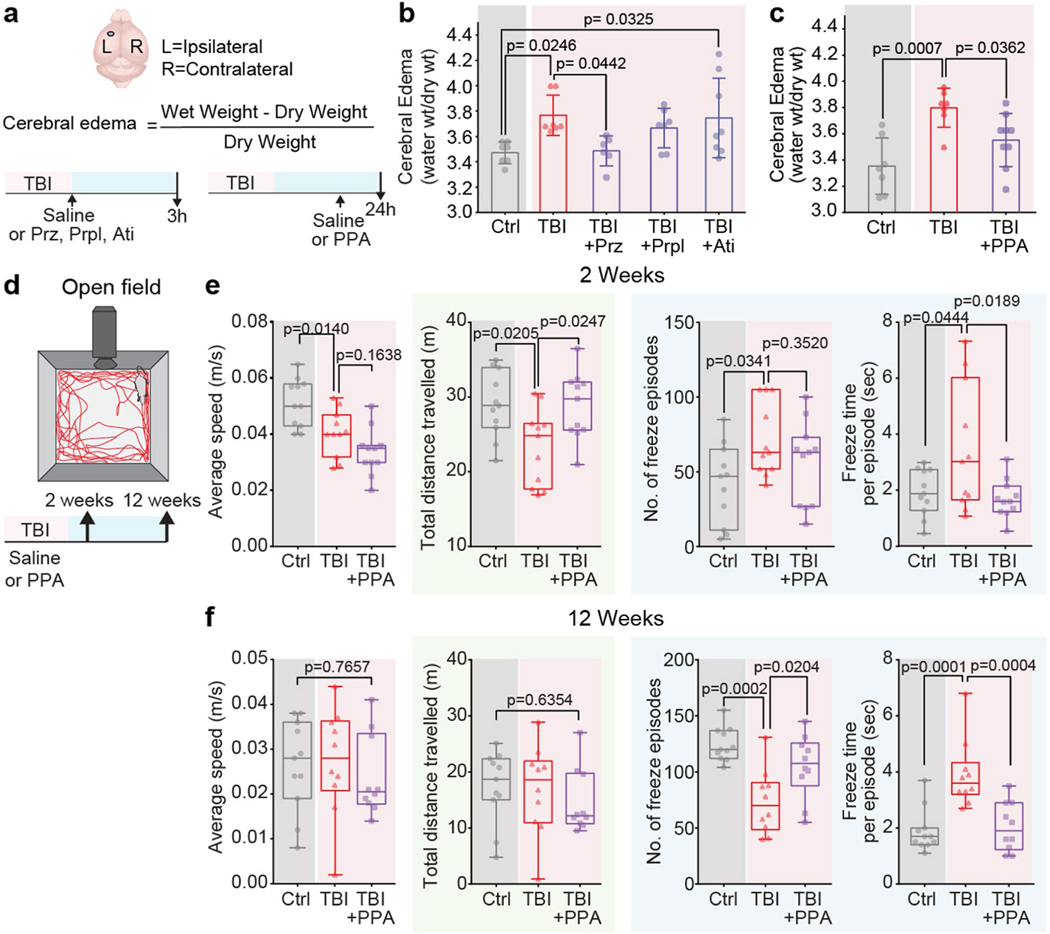
Extended Data Fig. 1 |. Effect of individual components of PPA is less efficient in reducing cerebral oedema after TBI. Locomotor and anxiety-like behaviour of post-traumatic brain injury mice is relieved by PPA treatment.
a-b, The severity of cerebral oedema in the mouse brain was estimated 3 h post-TBI with or without treatment of prazosin (Prz), propranolol (Prpl), and atipamezole (Ati). Experimental groups were compared by one-way ANOVA (n = 35 mice, F4,30 = 3.73, p = 0.014,) followed by Dunnett’s multiple comparisons test; Sham-Control vs TBI-saline (n = 7 mice each, p = 0.025), TBI-saline vs Prz (n = 6 mice, p = 0.044), Prpl (n = 7 mice, p = 0.72), and Ati (n = 8 mice, p = 0.99). c, Cerebral oedema measurement in mice 24 h post-TBI with or without PPA treatment at 23 h. Experimental groups compared by one-way ANOVA (n = 23 mice, F2,20 = 9.387, p = 0.001) followed by Dunnett’s multiple comparisons test; Sham-Control (n = 7 mice) vs TBI-saline (n = 7 mice), p = 0.0007, TBI-saline vs TBI + PPA (n = 9 mice, p = 0.036). d, Locomotion, anxiety-like behaviours, and exploration abilities at two and 12 weeks post-TBI, with or without PPA treatment. Data shown as box and whisker plot with median, and min-max values, the dots are biological replicates/mice. e, Two-week evaluation (n = 33 mice, 11 mice/group, group means were compared by one-way ANOVA followed by Tukey’s multiple comparison test); average speed (F2,30 = 12.16, p = 0.0001; Control vs TBI-saline, p = 0.014, TBI-saline vs TBI-PPA, p = 0.164), total distance travelled (F2,30 = 5.291, p = 0.0108; Control vs TBI-saline, p = 0.021, TBI-saline vs TBI-PPA, p = 0.025), number of freeze episodes (F2,30 = 3.482, p = 0.0437; Control vs TBI-saline, p = 0.034; TBI-saline vs TBI-PPA, p = 0.352), and freeze time per episode (F2,30 = 4.944, p = 0.0139; Control vs TBI-saline, p = 0.044; TBI-saline vs TBI-PPA, p = 0.019). f, Twelve-week evaluation; n = 31 mice; Control (n = 11 mice), TBI-saline (n = 10 mice), TBI + PPA (n = 10 mice), group means were compared by one-way ANOVA followed by Tukey’s multiple comparison test where applicable. Average speed (F2,28 = 0.2695, p = 0.7657), total distance travelled (F2,28 = 0.4609, p = 0.6354), number of freeze episodes (F2,28 = 11.47, p = 0.0002; Control vs TBI-saline, p = 0.0002; TBI-saline vs TBI-PPA, p = 0.0204), and freeze time per episode (F2,28 = 14.2, p < 0.0001; Control vs TBI-saline, p = 0.0001; TBI-saline vs TBI-PPA, p = 0.0004). Bar graphs show mean and SEM (b, c), box and whisker plots show median and min-max values (e, f), and the dots are biological replicates/mice.

