
Extended Data Fig. 2 |. Transcranial live imaging of tracer movement is as reliable as ex vivo and in vitro slice imaging.
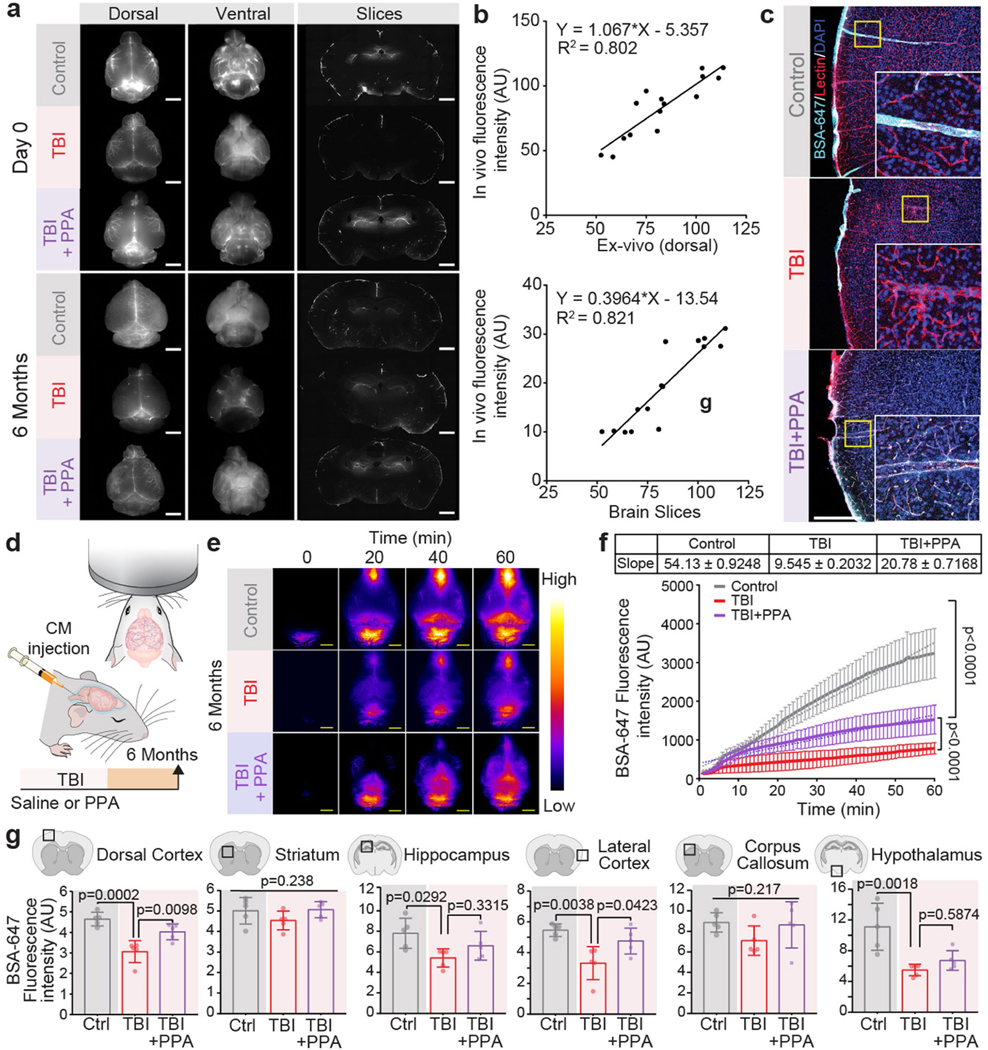
a, Representative dorsal and ventral views of brain imaged by ex vivo conventional fluorescent microscopy in control, TBI+saline, and TBI + PPA groups performed at (top) day 0 and (bottom) six months post-TBI (n = 4 biological replicates/mice at each time point). b, Regression analysis of BSA-647 fluorescence intensity for quantifying association of (top) transcranial in vivo vs ex vivo dorsal and (bottom) transcranial in vivo vs in vitro slices (R2 = 0.802 and 0.821, respectively). c, Representative images from confocal microscopy showing vascular ultrastructure, labelled with lectin (red) and BSA-647 tracer (cyan), colocalized/distributed along the blood vessels in non-injury control, TBI-saline, and TBI + PPA groups. d, Experimental scheme. e, Representative images (n = 3 biological replicates/mice). f, Quantification of transcranial time-lapse imaging of Alexa flour 647 conjugated BSA tracer signals in vivo (n = 16 mice; Control (n = 5), TBI-saline (n = 4), TBI + PPA (n = 7), 60 time points, linear regression, F2,177 = 1144, p < 0.0001). g, Mean pixel intensity of BSA-647 in different regions of the brain (n = 5 mice/group, multiple slices averaged per mouse, group means compared using one-way ANOVA followed by Tukey’s multiple comparison test where applicable): dorsal cortex (F2,12 = 17.59, p = 0.0003; Control vs TBI-saline, P = 0.0002; TBI-saline vs TBI + PPA, p = 0.0098), striatum (F2,12 = 1.621, p = 0.238), hippocampus (F2,12 = 4.413, p = 0.0366; Control vs TBI-saline, p = 0.0292; TBI-saline vs TBI + PPA, p = 0.332), lateral cortex (F2,12 = 8.807, p = 0.0044; Control vs TBI-saline, p = 0.0038; TBI-saline vs TBI + PPA, p = 0.0423), corpus callosum (F2,12 = 1.737, p = 0.217), and hypothalamus (F2,12 = 11.33, p = 0.0017; Control vs TBI-saline, p = 0.0018; TBI-saline vs TBI + PPA, p = 0.587). Data shown as scatter plot with trendline (b), line graph of group means with SEM (f), bars show mean and SEM (g), and the dots are biological replicates/mice. Scale: (a, c) 5 mm, (e) 100 μm.