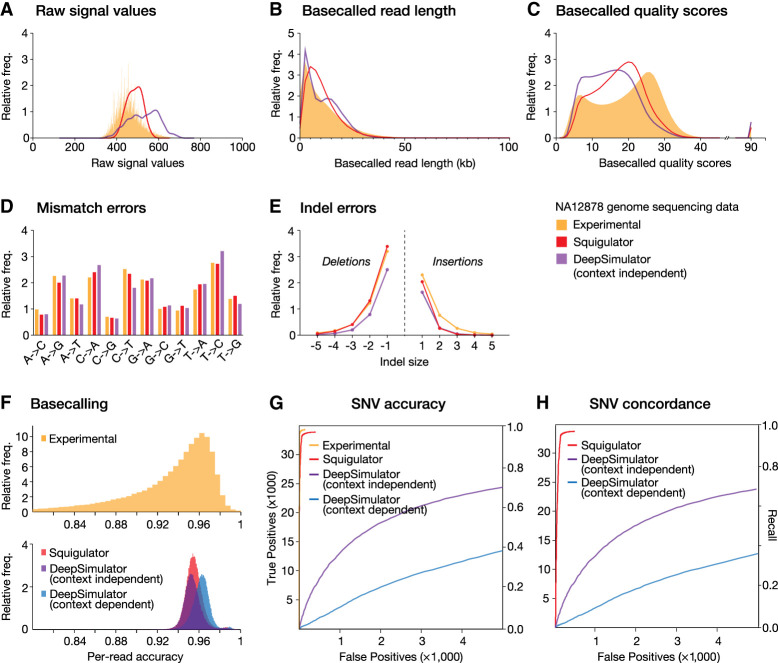
Figure 2.
Comparison of experimental and simulated NA12878 signal data sets. (A–C) Frequency histograms show distributions of raw signal values (A), basecalled read lengths (B), and Phred quality scores (C) in experimental data (orange) and simulated data sets from Squigulator (orange) or DeepSimulator (purple), based on the reference individual NA12878. A Guppy HAC basecalling model was used. (D,E) For the same data sets, bar charts show the relative frequencies of each possible base substitution (D), and line plots show the relative frequency of insertions and deletions of different sizes (E). Substitution and indels errors are determined relative to the GRCh38 reference genome after alignment with minimap2. (F) Guppy basecalling accuracy (HAC model), as measured by read:reference identity score distributions, for experimental (upper) and simulated (lower) data sets. Simulated data are from Squigulator (red) or DeepSimulator with context-independent (purple) or context-dependent (blue) settings. (G) ROC curves evaluate accuracy of SNV detection with Clair3 on the same data sets (colors as above). (H) ROC curves evaluate concordance of SNVs detected with real experimental NA12878 data set versus simulated data from Squigulator or DeepSimulator (colors as above). SUP basecalling was used to maximize accuracy of SNV detection. The left vertical axes in ROC curves show absolute numbers of detected SNVs, and right vertical axes show fraction of true positives detected (i.e., recall or sensitivity).

