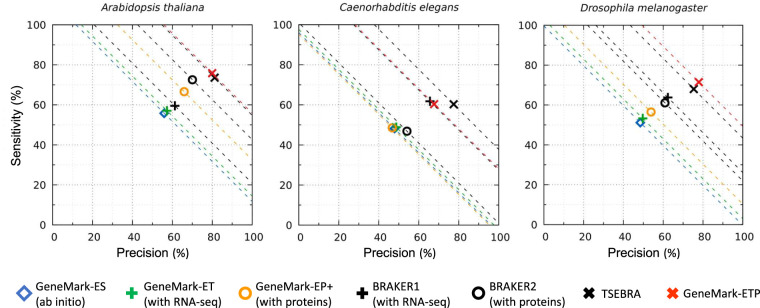
Figure 3.
Gene-level Sn and Pr of GeneMark-ETP and six other gene finders were computed for the three compact genomes: C. elegans, A. thaliana, and D. melanogaster. The dashed lines correspond to constant levels of (Sn + Pr)/2. The true positives were defined with respect to the complete set of annotated genes (either in RefSeq or Ensembl, which had identical annotations of these genomes). The “order excluded” protein databases were used.

