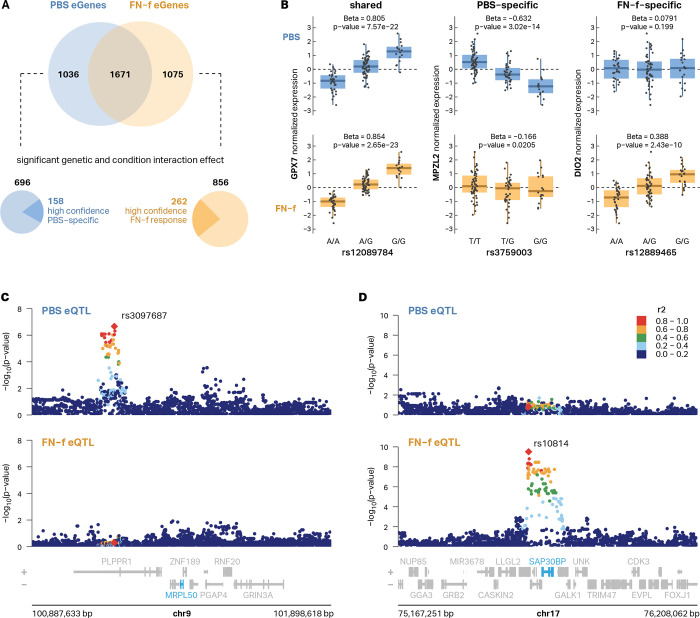
Fig 3 |. Genetic differences impact gene expression in resting and activated chondrocytes.
(A) A Venn diagram depicts the overlap between eGenes identified in PBS vs FN-f-treated conditions (top). Explicitly testing for the interaction between condition and genotype we identified 696 lead eQTLs with a stronger effect in PBS-treated cells and 856 lead eQTLs that exhibited a stronger effect in FN-f-treated cells (response eQTLs) which were further filtered to reveal 158 and 262 high-confidence PBS- and FN-f-specific lead eQTLs respectively (bottom). (B) Boxplots of genotypes vs normalized expression depicting examples of PBS-specific (MPZL2), FN-f-specific (DIO2), and shared (GPX7) eQTLs. Locus zoom plots show examples of (C) PBS-specific (MRPL50) and (D) FN-f-specific (SAP30BP) eQTL signals. Signals are colored by LD to the signal lead variant, denoted as red diamonds and labeled with their rsID.

