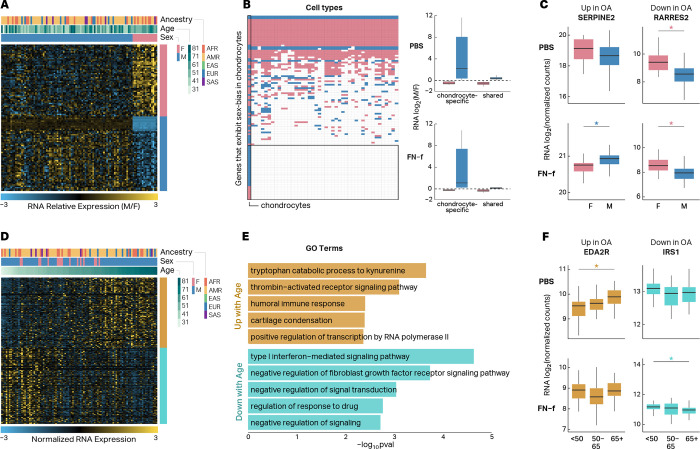
Fig 2 |. Genes with sex- and age-dependent expression patterns include OA-related genes.
(A) Heatmap depicting the 108 genes that exhibit sex-biased expression in human chondrocytes. (B) Heatmap depicting genes that exhibit sex-biased expression in human chondrocytes and whether or not they exhibit sex-biased expression across 44 other cell lines and tissues analyzed by the GTEx consortium (left). Boxplots depicting the fold-changes (M vs F) of sex-biased genes that are specific to chondrocytes or shared with at least one other tissue (right). (C) Boxplots depicting RNA log2 fold change of two genes (SERPINE2 and RARRES2) that exhibit sex-biased expression in human chondrocytes and are differentially expressed in OA tissue. Stars indicate significance (adjusted p-value < 0.01) and are colored by male-biased (blue) or female-biased (pink) expression. (D) Heatmap depicting the 196 genes that exhibit age-related expression changes in human chondrocytes. (E) GO and KEGG terms that are enriched in genes that show increased (gold) or decreased expression (turquoise) with age in human chondrocytes. (F) Boxplots depicting RNA log2 normalized counts of two genes (EDA2R and IRS1) that exhibit age-related expression changes in human chondrocytes and are differentially expressed in OA tissue. Stars indicate significance (adjusted p-value < 0.05) and are colored by genes that are up with age (gold) and down with age (turquoise).

