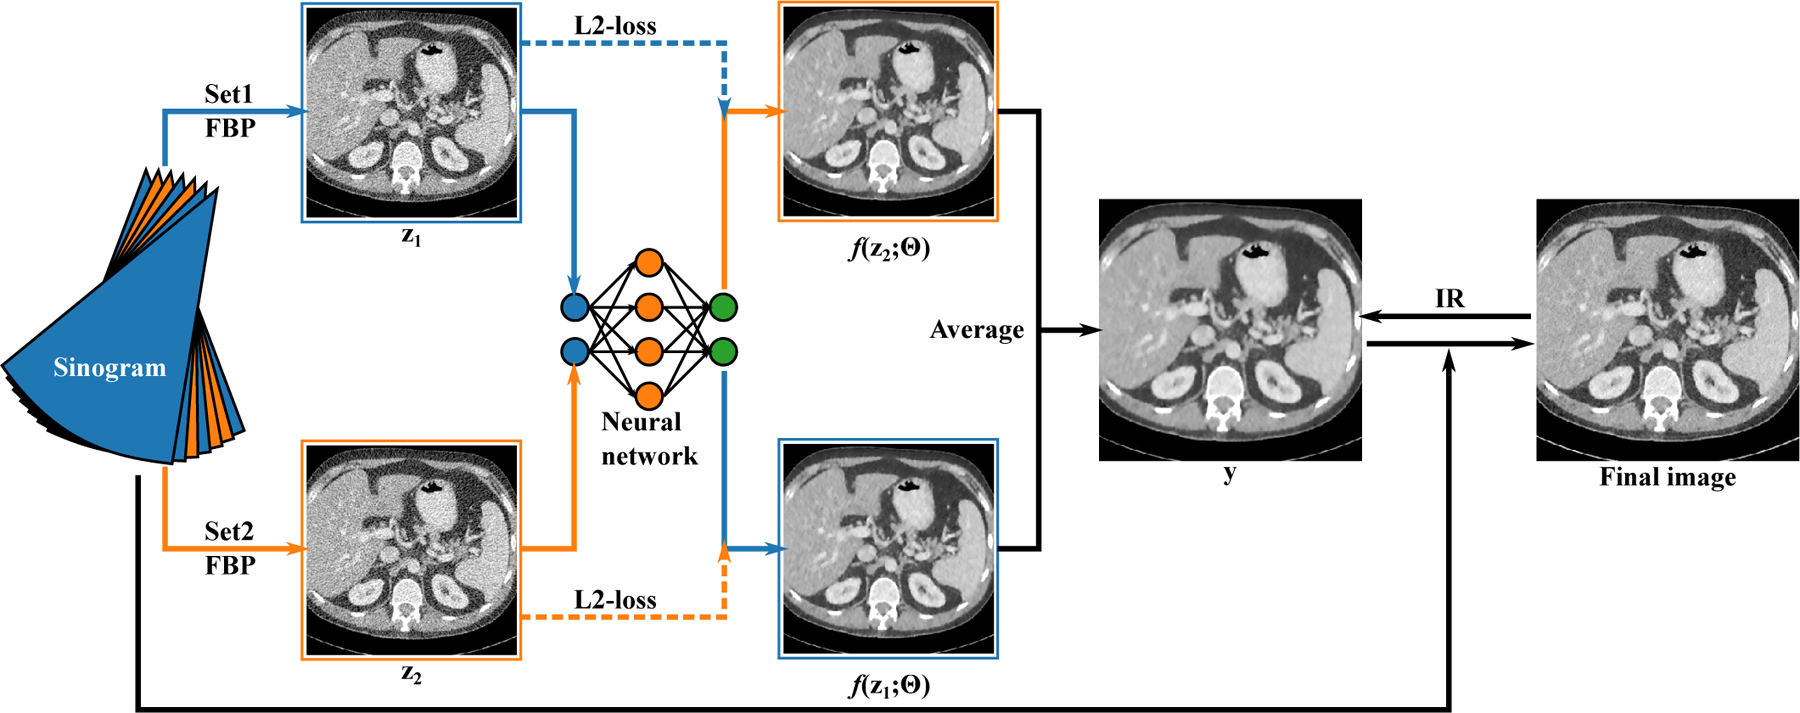
Figure 1:

The schematic of the Noise2Noise reconstruction. The sinogram is divided into two sets (blue and orange) and reconstructed with FBP independently ( and ). The network tries to map to and vice versa. The average of the network outputs, , is used as a prior during the IR. The IR updates both the image to be reconstructed and the network weights.
