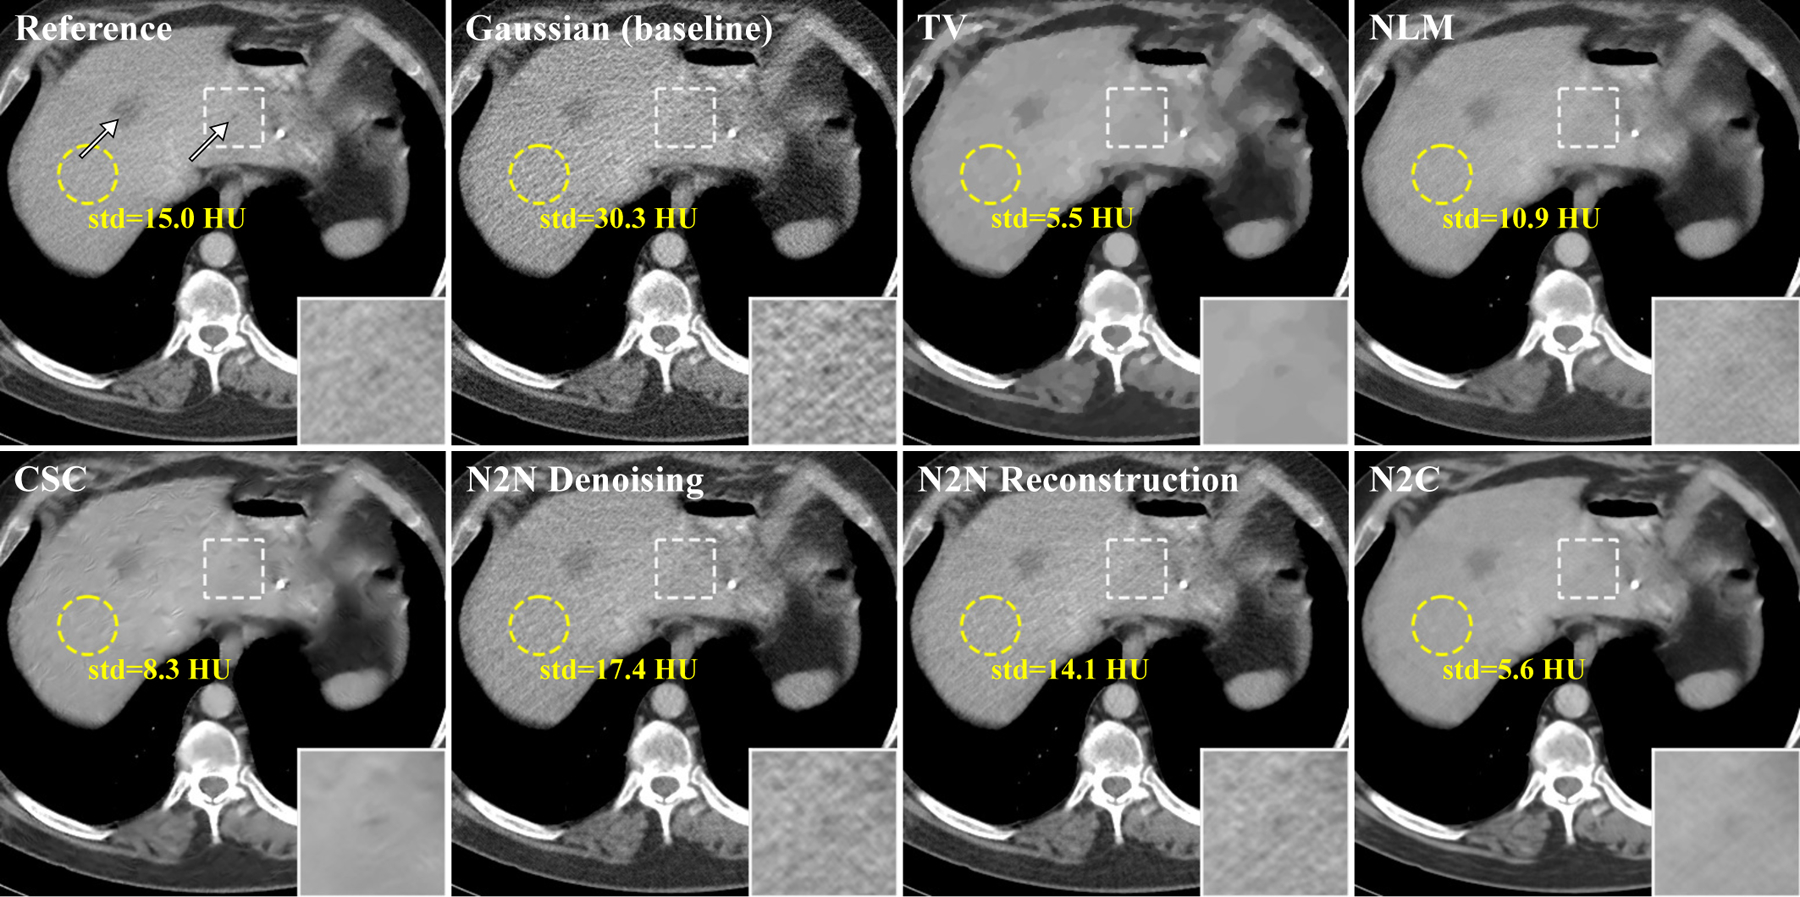
Figure 5:

One of the reconstructed slices. Two metastases are marked by white arrows on the reference image and one of them is zoomed in. The display windows are 40 ± 400 HU. The standard deviations inside the yellow circles were also calculated. Gaussian was used as baseline instead of FBP to eliminate the modeling bias between IR and analytical reconstruction. Compared to Noise2Noise reconstruction, Noise2Noise denoising does not fine-tune for each testing image.
