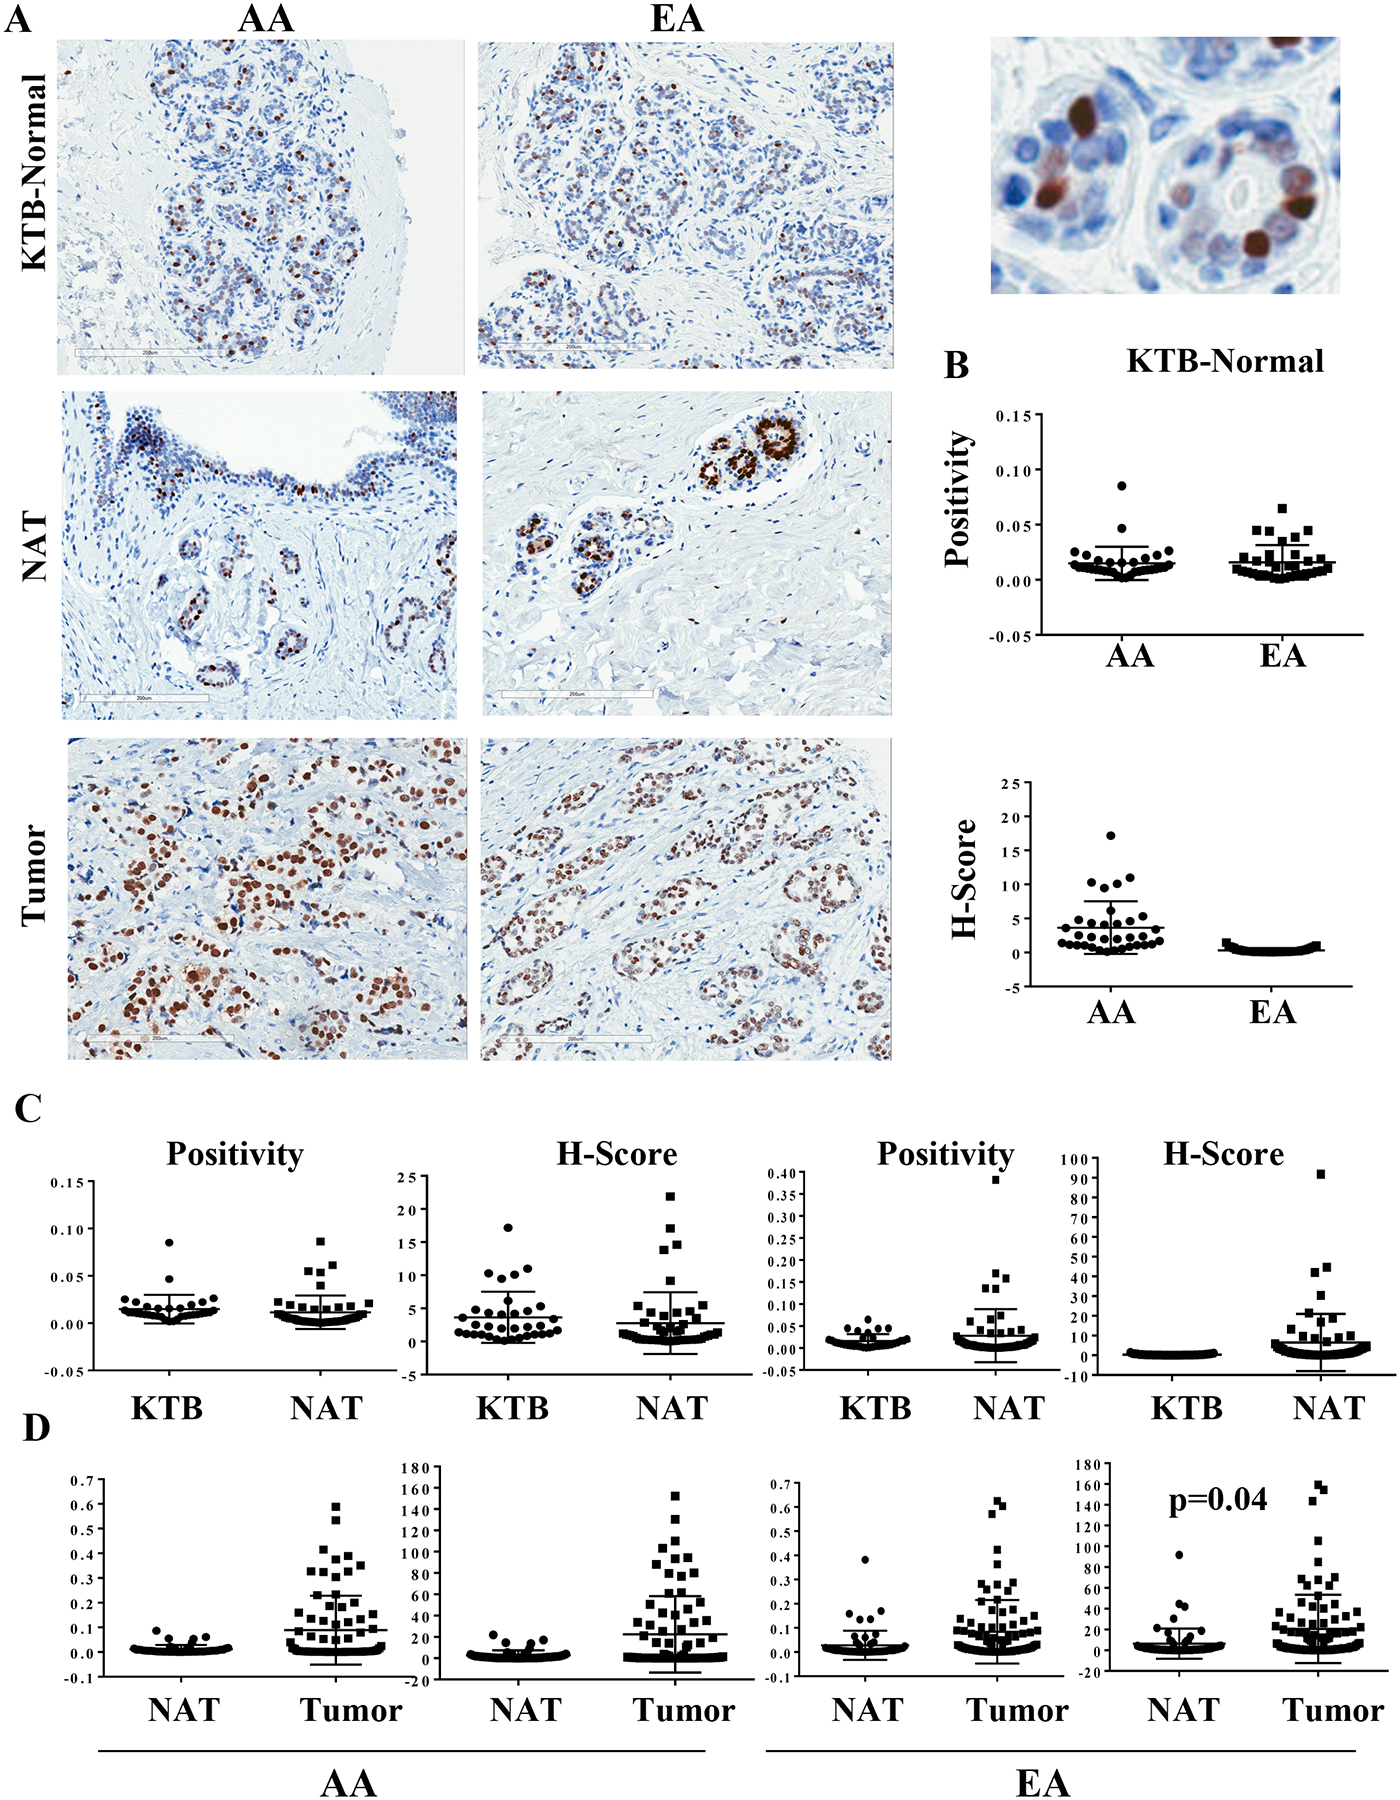
Figure 3:

ERα expression pattern in KTB-normal, NATs and in breast tumors. A) Representative immunohistochemistry of KTB-normal, NATs and tumors of AA and EA women. Enlarged view of a KTB-normal is shown on right (top). B) Differences in ERα expression (positivity and H-score) between KTB-normal of AA and EA women. C) Differences between KTB-normal and NATs in AA and EA women. D) Differences between NATs and tumors in AA and EA women.
