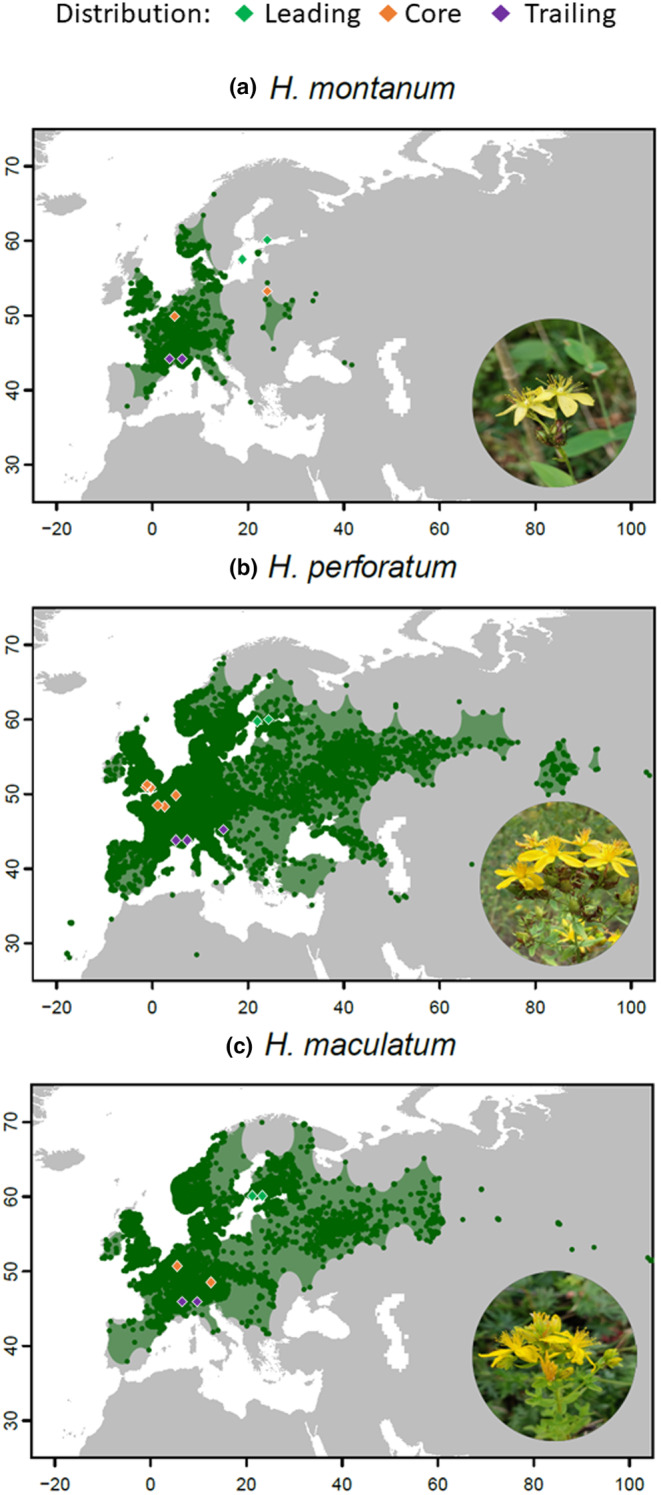
FIGURE 1.

Distribution areas of (a) Hypericum montanum, (b) H. perforatum, and (c) H. maculatum during years 1900–2022. Dark green points are filtered observations of the species, while the lighter green polygon represents the projected distribution based on observations published in GBIF (www.gbif.org). Origins of the study populations are indicated with different colors representing their distribution: Leading (green), core (orange), and trailing (purple). Photo credit of H. montanum: https://www.inaturalist.org/observations/88095325, H. perforatum: https://www.inaturalist.org/observations/172389923, and H. maculatum: https://inaturalist.ca/observations/53887149.
