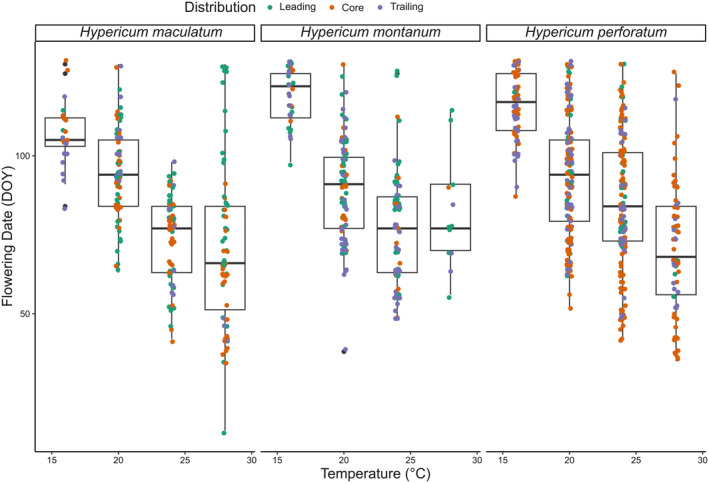
FIGURE 2.

Date of flowering (DOY) as a function of temperature grouped by species and distribution area. The distribution area is indicated by color: Leading (green), core (orange) and trailing (purple). Horizontal jitter was introduced to aid visualization.
